Trading Update: Thursday January 12, 2023
Emini pre-open market analysis

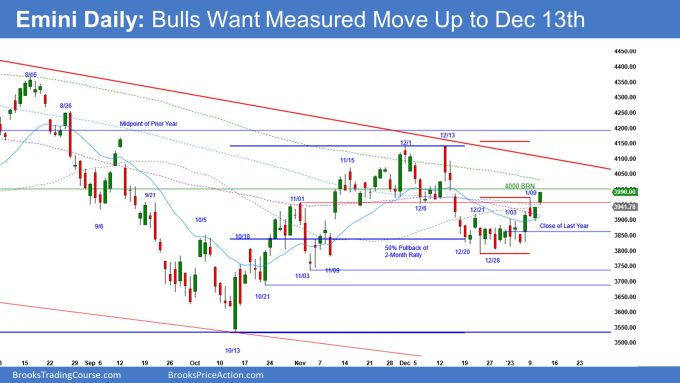
Emini daily chart
- Yesterday was a strong bull bar closing on its high just under the 4,000 big round number. The bulls want strong follow through today, trapping the bears into losing shorts.
- The bulls want the breakout above January 9th to lead to a measuring gap and a measured move up from the December 28th low to the January 9th high, which projects up to the December 13th high.
- The 4,000 round number has been an obvious magnet for over 7 months and will likely continue to be a magnet.
- While the market is probably Always In Long, the bulls likely need one more bar to convince traders that the market is going up to the December 13th high and the bear trendline above (see chart above).
- The bears want yesterday’s bull trend bar to lead to a wedge top with January 3rd and 9th and for today to have a strong bear bar closing on its low.
- Some bears sold below January 9th and are looking to scale in higher. Those bears may be sufficiently disappointed with the two consecutive bull trend bars over the past few days that the bears may be interested in trying to exit breakeven on the entire trade.
- Today is an important bar. If bulls can get another strong bull trend bar, it will increase the odds that they will get a measured move up to the December 13th high.
- The bears still want a second leg down from the December 13th 5-bar bear breakout. The rally from December 28th being as strong increases the odds that any second leg down will likely lead to sideways trading.
- Overall, traders will pay close attention to see if the bulls can get a strong follow-through bar after yesterday’s breakout above January 9th. Since the market is in a trading range, traders should assume that the bulls will be disappointed today.
Emini 5-minute chart and what to expect today
- Emini is up 5 points in the overnight Globex session.
- The Globex market has been in a tight trading range for most of the overnight session.
- Early this morning, the market broke out to the upside and reached 4,019.75 before reversing down sharply during the 5:30 AM PT report.
- The report at 5:30 AM PT has a range of about 70 points in two bars that overlap each other.
- This means that traders should expect a lot of trading range price action going into the U.S. Session.
- Most traders should consider not trading the first 6-12 bars due to the odds of sideways trading and most breakouts not being successful.
- A trader can wait for a credible wedge top/bottom or a double top/bottom.
- Traders can also wait for a clear breakout with follow-through breaking out of the opening range.
- The January 9th high might be a magnet today. The bulls want to close far above it, and the bears want to close below it.
- The next likely important magnet today will be the open of the day. The bulls want follow-through buying on the daily chart and a close below the day’s open.
Emini intraday market update
- The market formed a big bear bar closing on its low for the first bar of the day.
- This was a strong enough breakout bar that the odds favored a second leg down, which was bar 2-5.
- The bulls got a strong reversal up at 7:00 AM PT, and although the bar does not look big, it was reasonable for bears to exit above it, betting that the bulls would get at least a small second leg up.
- On the Open, there is a 50% chance that the first initial move will reverse directions. This means that even though bars 1-4 were strong, there is a 50% chance the market will reverse up and develop a trading range.
- Another reason bulls would exit above the 7:00 or 7:05 AM PT rally is because the selloff was very climactic and exhaustive.
- The rally up to 9:20 is strong enough for a second leg up. However, the bears have done a good job of making the market go sideways.
- As of 8:55 AM PT, the market is still Always In Long; however, it has had a lot of trading range price action over the past several bars. The bulls still may get an upside breakout and an second leg up from the rally that ended on 7:15 AM PT.
Yesterday’s Emini setups

Brad created the SP500 Emini chart.
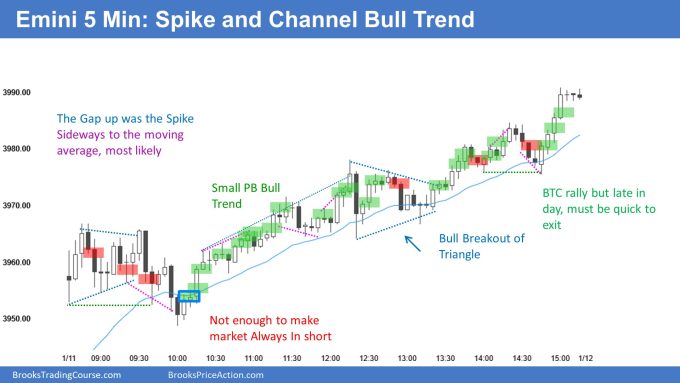
Here are several reasonable stop entry setups from yesterday. I show each buy entry with a green rectangle and each sell entry with a red rectangle. Buyers of both the Brooks Trading Course and Encyclopedia of Chart Patterns have access to a much more detailed explanation of the swing trades for each day (see Online Course/BTC Daily Setups).
My goal with these charts is to present an Always In perspective. If a trader was trying to be Always In or nearly Always In a position all day, and he was not currently in the market, these entries would be logical times for him to enter. These therefore are swing entries.
It is important to understand that most swing setups do not lead to swing trades. As soon as traders are disappointed, many exit. Those who exit prefer to get out with a small profit (scalp), but often have to exit with a small loss.
If the risk is too big for your account, you should wait for trades with less risk or trade an alternative market like the Micro Emini.
EURUSD Forex market trading strategies
EURUSD Forex daily chart

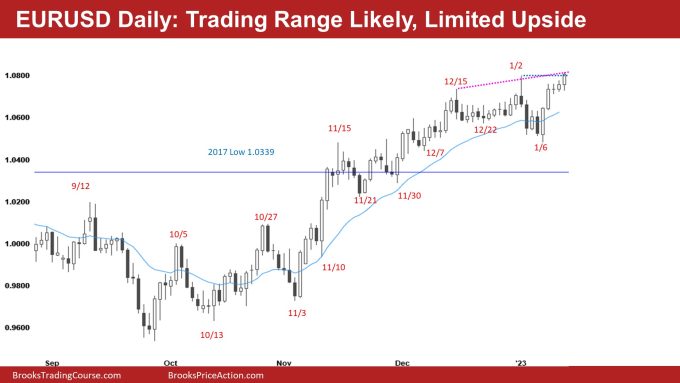
- The EURUSD is breaking out above the January 2nd high.
- As strong as the rally from the January 6th low is, the odds are that there will be sellers above the January 2nd high and that the market will go sideways soon, causing the bull’s disappointment.
- The selloff down to the January 6th low is enough to increase the odds of a trading range forming.
- While the bulls may get a measured move up in the past two weeks, more likely, the bulls will be disappointed soon, and the market will continue sideways.
- The bears will likely wait for a second entry short before looking to sell.
- If the bulls are going to be successful in getting a measured move up, they need a strong close above January 2nd and strong follow-through. Otherwise, most traders will assume the breakout above January 2nd will fail, leading to more sideways trading.
- As I have said, the rally from the October 2022 low is the first trendline break of a very tight bear channel that began in mid-2021 on the weekly chart.
- This means that the reversal up is likely minor, and the bulls will likely need a pullback to form a high-low major trend reversal. The pullback could fall to the December low before buyers are eager to buy.
- Overall, sideways is most likely on the daily chart.
Summary of today’s S&P Emini futures price action and what to expect tomorrow

Al created the SP500 Emini chart.
End of day review
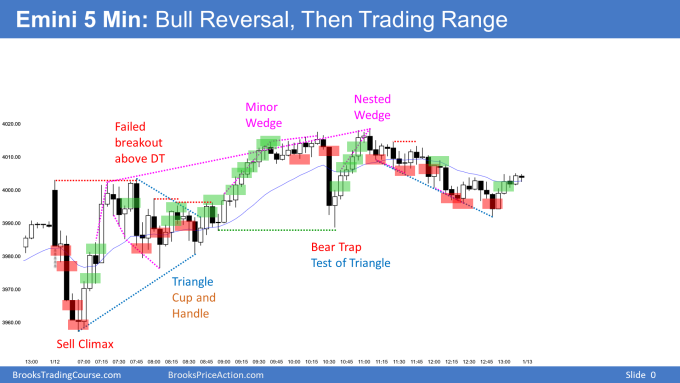
- Today was an opening reversal that led to a trading range day.
- The bulls reversed up from a strong sell climax. The odds favored a second leg down after the first 4 bars of the day; however, the second leg down went sideways after a strong rally up to the open of the day.
- The bulls had a strong reversal up to 7:15 AM PT. However, it ended up being a buy climax in a trading range that led to more sideways trading.
- The bulls got a cup and handle pattern and a larger second leg above the high of bar 1.
- The market formed a wedge top, leading to a selloff around 10:30 AM. The bear breakout was a sell vacuum test of the triangle and the midpoint of the day’s range.
- The bear breakout at 10:30 was strong enough for traders to expect a second leg down. The rally, up to 11:00 AM PM, ended up being a pullback from the 10:30 AM breakout, and the market had a second leg down.
- Overall, the day closed just above the open. However, it was still a trading range bar. While the bulls want higher prices on the daily chart, today is a warning that the bulls will likely be disappointed soon and that the market will begin to go sideways.
See the weekly update for a discussion of the price action on the weekly chart and for what to expect going into next week.
Trading Room
Al Brooks and other presenters talk about the detailed Emini price action real-time each day in the BrooksPriceAction.com trading room. We offer a 2 day free trial.
Charts use Pacific Time
When times are mentioned, it is USA Pacific Time. The Emini day session charts begin at 6:30 am PT and end at 1:15 pm PT which is 15 minutes after the NYSE closes. You can read background information on the market reports on the Market Update page.

