Emini bull flag after early October buy climax
Updated 6:59 a.m.
The Emini gapped up and had 2 strong bull bars. Yet, the 4th bar was a bear bar closing on its low. The bulls got out below the bar, fearful that this could be a failed breakout to a new all-time high. Traders know that 50% of strong moves on the open reverse, and when there is a strong sell signal bar, most bulls exit and many bears sell.
While yesterday was an outside day, it was not big. Therefore, there is a chance that today could become an even bigger outside day.
At the moment, there is a Big Up, Big Down pattern. This is trading range behavior. The reversal down was strong enough to make bulls hesitant to buy. In addition, it will make them quicker to take profits. Since the bears failed to get 3 consecutive bear bars, the bears lack conviction. This reduces the chances of a big bear day.
If there is a series of strong trend bars up or down, the day could become a trend day. At the moment, this is more likely a trading range open. In addition, the lack of follow-through up and down increase the odds of a lot of trading range trading.
Pre-Open market analysis
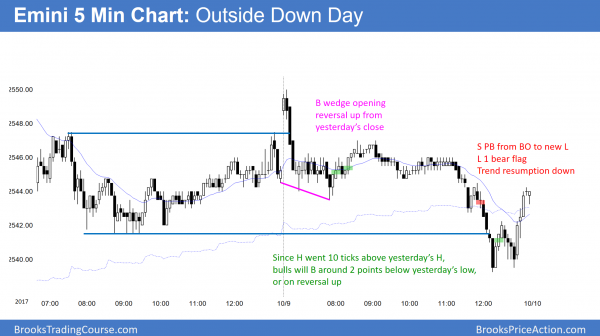
Friday was an inside day in a bull trend and therefore a 1 day bull flag. By yesterday trading above Friday’s high, the buy signal triggered. Yet, the Emini sold off on the open. After a tight range, the bear trend resumed and yesterday traded below Friday’s low. This is an inside day. The bulls bought the selloff, which reduces the changes for much follow-through selling today. In addition, an outside day often leads to an inside day. This would then create an ioi (inside day – outside day – inside day) bull flag. It also is a sell signal for a micro double top.
Most likely, it is the start of a tight trading range. The odds favor at least a small 2nd leg up after the 2 week breakout, but that leg up will probably become part of a taller tight trading range. The range will probably last at least a couple of weeks. The bears would then try again for a reversal down.
Buy climaxes with resistance just above
The 2 week rally was extreme, and Thursday rally was exceptionally extreme. When there is a buy climax, the Emini often pulls back for a few days. Yet, the rally was strong enough to make a 2nd leg up likely. However, there are measured move targets at 2559.50 and 2579.25.
In addition, the weekly and monthly charts are late in buy climaxes. Therefore the upside from here is probably small. The odds favor a 100 – 200 point pullback within the next few months, possibly during the upcoming earnings season. However, the next week or two will probably be sideways to up.
Overnight Emini Globex trading
The Emini is up 5 points in the Globex market. However, since yesterday was an outside day, there is an increased chance that today will be an inside day. In addition, even if today goes above yesterday’s high, it would be at the top of a 3 day tight range. This reduces the odds of a strong rally, despite the 20 gap bar buy setup on the 60 minute chart.
Since the 2 week rally has been so strong and there are measured move targets above, the odds favor higher prices. The bulls will therefore try for a strong bull trend day. Traders will watch for an early strong bull breakout. However, a continuation of the 3 day range is more likely. Despite the micro double top on the daily chart, a strong bear trend is unlikely after yesterday’s late reversal up on the 5 minute chart with a strong bull trend on the daily chart.
Yesterday’s setups
Here are several reasonable stop entry setups from yesterday. I sometimes also show limit order entries and entries on the close of bars.
EURUSD Forex market trading strategies
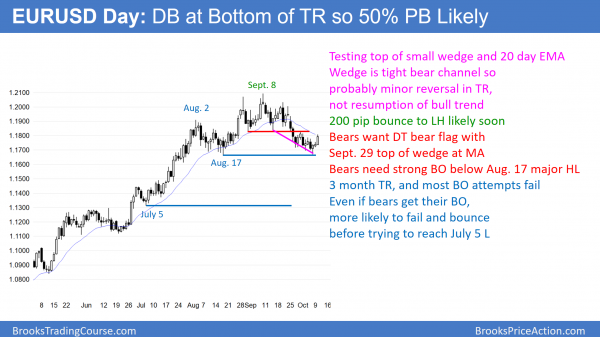
The EURUSD daily Forex chart is turning up from a test of the August 17 low. There is also a small wedge bottom.
The EURUSD daily Forex chart is turning up from just above the August 17 major higher low. The bulls want a resumption of the 10 month bull trend. But, just like the bulls disappointed the bears in their attempt to break below the range, the bears will probably disappoint the bulls. This is because a trading range resists breaking out. Consequently, 80% of breakout attempts up and down fail.
The 2 month selloff has been in a tight bear channel. Therefore the 3 day reversal up is minor. This means that it is more likely going to lead to a small rally in the trading range than a resumption of the bull trend.
Legs in trading range usually fail to breakout
Rallies in a trading range typically go above some resistance. The August 31 low is a breakout point and therefore a target. In addition, 50% pullbacks are common. Hence, a 200 pip rally is likely.
The September 29 lower high is around the 20 day exponential moving average. Both are resistance. Consequently, the 3 day rally might stall here for a day or two. If the bulls instead quickly break strongly above, the odds are that the rally will reach 1.2000 before failing. If instead the rally reverses down strongly, the bears will probably get a break below the August 17 low before the bulls get their 200 pip rally.
Overnight EURUSD Forex trading
The 5 minute chart has been in a 3 day spike and channel bull trend. The rally is a buy vacuum test of the resistance at the September 29 lower high and the 20 day EMA.
That resistance is about 25 pips higher. The odds are that the rally will stall there for 1 – 3 days. In addition, the rally has been in a fairly broad channel. That means it is not weak. This further increases the odds of a trading range starting today or tomorrow.
While it is possible that the rally will break strongly above resistance or collapse below support, that is not what usually happens in a trading range. More likely, there will not be much energy and the 5 minute chart will begin to go sideways today.
The odds are that the daily chart will have a 200 pip rally within a few weeks. This means that bulls will look to buy pullbacks for a small swing up. Once the chart reaches the resistance at the 50% pullback and the August 31 low, bears will begin to sell, expecting another leg down. However, the rally might continue up to the 1.2000 big round number and the September 20 lower high before the bears regain control.
Summary of today’s S&P Emini futures price action and what to expect tomorrow
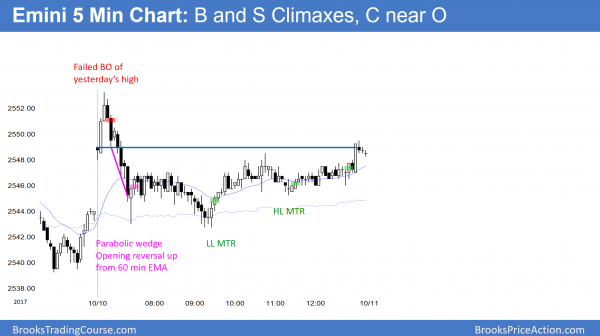
The Emini reversed down sharply from a breakout to an new all-time. It could not reverse up from a parabolic wedge bottom, but bounced up from a lower low major trend reversal.
Today sold off strongly from a new all-time high, but spend the rest of the day in a trading range. The daily chart is still bullish, but the bulls are now taking profits and the bear are starting to sell above prior highs. While the daily chart is still bullish, all of the higher time frames are in buy climaxes.
The upside from here is probably limited to about 20 points up to a measured move target. Since the higher time frames are so bullish, the bulls will buy any reversal down, even if it is more than 5%.
See the weekly update for a discussion of the price action on the weekly candlestick chart and for what to expect going into next week.
Traders can see the end of the day bar-by-bar price action report by signing up for free at BrooksPriceAction.com. I talk about the detailed S&P Emini futures price action real-time throughout the day in the BrooksPriceAction.com trading room. We offer a 2 day free trial.
When I mention time, it is USA Pacific Standard Time (the Emini day session opens at 6:30 am PST, and closes at 1:15 pm PST). You can read background information on the intraday market reports on the Intraday Market Update page.


