Trading Update: Wednesday November 2, 2022
Emini pre-open market analysis
Emini daily chart
- Today is a FOMC Day, and bears want strong selloff to be the catalyst for a strong bear breakout following the report.
- Yesterday is a reminder that the market may have to pull back before reaching the 4,000 big round number.
- While the rally up to November 1 is strong, it is also climactic and looks like a leg in a trading range. This increases the odds that the market may have to pull back before the market can rally much higher.
- If the market does pull back, it could go down to the October 21 high.
- As Al Brooks stated in the webinar yesterday, it is not a matter of if we get to 4,000 again, but when we get to 4,000. The point is that even if the market has a pullback down to the October 21 high, the odds will still favor a second leg up that reaches the 4,000 big round number. The 4,000 big round number has been a strong magnet all year, and the market will likely have to test it again.
- The bears see a double top with the September 21 high. They want a strong selloff and break below the October 13 neckline. Buyers will likely be below any selloff, and the market will test higher.
- The market may return to the August 24 low breakout gap. While the market closed the Globex session, it failed to close the gap on the day-only (RTH) session.
- Overall, traders expect a pullback here and will pay close attention to the strength of the pullback. Bulls will be more eager to buy, betting on a rally up to the 4,000 big round number if the pullback is weak.
Emini 5-minute chart and what to expect today
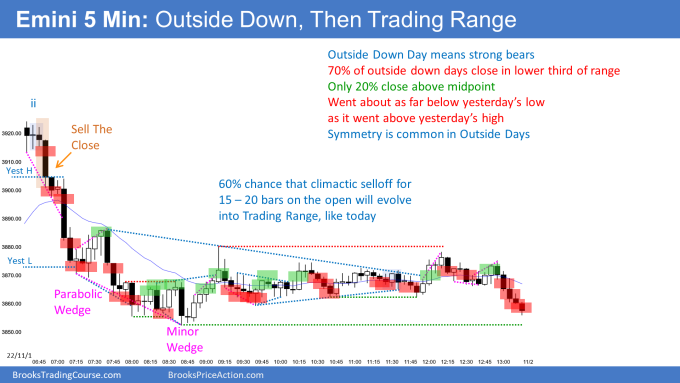
- Emini is up 1 point in the overnight Globex session.
- The Globex market has been in a trading range for most of the overnight session.
- The bulls want a major trend reversal on the open and to erase yesterday’s selling pressure.
- The bears want the trend resumption down after yesterday’s selling.
- As always, traders should expect a limit order market on the open and for most breakouts to fail.
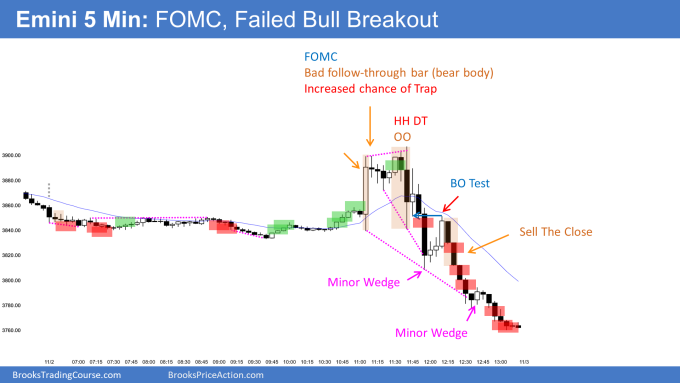
- Today is a FOMC day, so traders should treat the day as having two different sessions.
- Traders should stop trading 1 hour before the report is released.
- Once the report has been released, traders should wait to see the follow-through after the FOMC report bar at a minimum before trading. This means traders should not trade for at least 10 minutes after the release of the FOMC report.
- While the FOMC release can have a strong move up or down, the market often goes sideways. This means traders should expect disappointment and trading range price action after the FOMC release.
- As always, traders should consider waiting for 6-12 bars on the open day before placing a trade. They can also consider waiting for a credible stop entry, such as a double top/bottom or a wedge top/bottom.
Yesterday’s Emini setups

Al created the SP500 Emini charts.
Here are several reasonable stop entry setups from yesterday. I show each buy entry with a green rectangle and each sell entry with a red rectangle. Buyers of both the Brooks Trading Course and Encyclopedia of Chart Patterns have access to a much more detailed explanation of the swing trades for each day (see Online Course/BTC Daily Setups).
My goal with these charts is to present an Always In perspective. If a trader was trying to be Always In or nearly Always In a position all day, and he was not currently in the market, these entries would be logical times for him to enter. These therefore are swing entries.
It is important to understand that most swing setups do not lead to swing trades. As soon as traders are disappointed, many exit. Those who exit prefer to get out with a small profit (scalp), but often have to exit with a small loss.
If the risk is too big for your account, you should wait for trades with less risk or trade an alternative market like the Micro Emini.
EURUSD Forex market trading strategies
EURUSD Forex daily chart

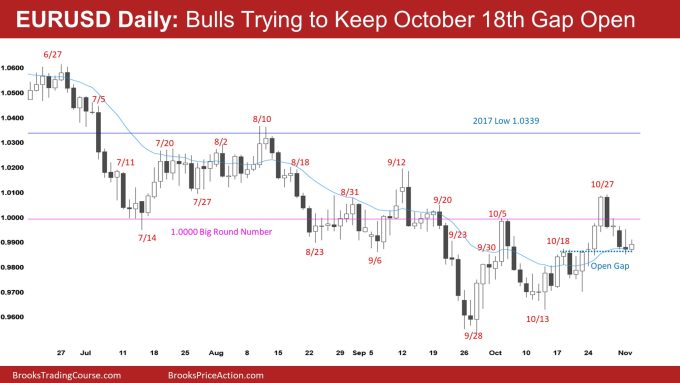
- The bulls are trying to keep the October 18 breakout gap open. At the moment, it is a measuring gap, and the bears need to get a close below the October 18 high for traders to agree that the gap has closed.
- The bears have a 4-bar micro channel, increasing the odds of a second leg down.
- There were buy-the-close bulls that bought the October 26 close and likely scaled in lower. While the market will probably test the October 26 close soon and let those traders out breakeven, some of those bulls are disappointed enough that they may try and exit breakeven on the entire trader on any bounce.
- The bears hope the rally up to October 26 is a large second leg trap in a bear channel. Those bears want a selloff that led to a breakout below the September lows. The selloff will likely lead to buyers below, and the downside will be limited.
- The bulls had a higher low major trend reversal on October 13. However, the channel down was tight. This increases the odds that the market might have to get down to the October 13 low and form a double bottom higher low major trend reversal before the market can go much higher.
- Overall, the bears, have been in a channel since mid-2021, and the odds favor this bear channel evolving into a trading range. For this to happen, the bulls will likely get a rally on the daily chart lasting several months.
Summary of today’s S&P Emini futures price action and what to expect tomorrow

Al created the SP500 Emini charts.
End of day review
- Video Update soon.
See the weekly update for a discussion of the price action on the weekly chart and for what to expect going into next week.
Trading Room
Traders can see the end of the day bar-by-bar price action report by signing up for free at BrooksPriceAction.com. Al talks about the detailed S&P Emini futures price action real-time throughout the day in the BrooksPriceAction.com on trading room days. We offer a 2 day free trial.
Charts use Pacific Time
When times are mentioned, it is USA Pacific Time. The Emini day session charts begin at 6:30 am PT and end at 1:15 pm PT which is 15 minutes after the NYSE closes. You can read background information on the market reports on the Market Update page.


Hello Brad. Good to meet you in Orlando.
I’m looking to open a Trade Station account. For trading the eMini/MES do you or Al use the TS Futures Plus platform or Regular Trade Station?
Thank you, Cliff
Al and I both use the regular TradeStation 10.0 Platform. I personally do not like the TS Futures Plus platform, but I know it is popular.
Thnx.
Hey Clifford. Just a heads-up, if you’re a first responder or active duty/veteran you can get a great discount from Trade Station.