Trading Update: Wednesday April 19, 2023
S&P Emini pre-open market analysis
Emini daily chart
- The Emini formed bear bar yesterday that closed at its midpoint. The bears see failed breakout from Monday’s bull inside bar.
- The bulls see it as a pullback from Monday’s inside bar. However, the market is forming a parabolic wedge over the past 8 bars. While and reversal down will probably be minor, the market will probably pull back for a few days.
- In general, bars like Mondays inside bar are low-probability buys, and any upside breakout like yesterday’s gap usually fails.
- Bears will see yesterday’s bear close as a credible short in a trading range. It is a lower probability sell since the channel up is tight.
- However, if the bears get two to their consecutive bear bars closing on their lows, traders will begin to expect a lower process and a test of the March 22nd high.
- The market will probably get closer to the moving average over the next few days. There will probably be buyers around the moving average.
- Overall, traders should expect and selloff to be minor, leading to sideways trading. However, if the bears can get consecutive strong trend bars, the odds of lower prices will increase. Traders will pay close attention today to see what kind of entry bar the bears can get below yesterday’s low. The bulls want to prevent the bears from getting a strong entry bar and increase the odds of buyers below.
Emini 5-minute chart and what to expect today
- Emini is down 20 points in the overnight Globex session.
- The Globex market on the 60-minute chart got a second leg down after yesterday’s selloff during the first half of the U.S. Session.
- The channel down since last night is tight, which increases the odds of lower prices.
- As I mentioned above, the bears want to form a strong entry bar today following yesterday’s bear reversal bar.
- Traders should be prepared for a possible bear trend day today; however, they should always expect a trading range.
- Since the market will gap down below yesterday’s low, the bulls will buy, betting on limit order traders making money below yesterday’s bear bar. This means that yesterday’s low will be a magnet today.
- If the bears start to get consecutive bear trend bars on the open, the odds of a bear trend from the open will increase. Even if the bears get a trend from the open, there is a 60% chance of it evolving into a trading range.
- As I often say, most traders should wait for 6 to 12 bars before placing a trade. By waiting for this gives a trader more information on the type of day.
- A trader can wait for a credible double top/bottom or a wedge top/bottom before placing a trade. An opening swing trade often begins before the end of the second hour, following one of the patterns mentioned above.
Emini intraday market update
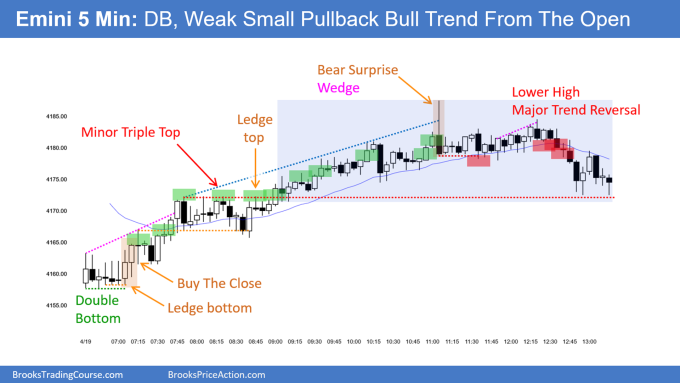
- The Emini gapped down and rallied from a trend from the open.
- The first 6 bars of the day went sideways in a tight trading range.
- The bulls got a bull breakout with follow-through on bars 6 and 7, making the market Always In Long.
- As of 9:10 AM PT (bar 23) the market is in a small pullback bull trend. There is a 60% chance that the small pullback trend will evolve into a trading range and not last all day.
- Bears need to wait for more selling pressure, though. Small pullback bull trends (Tight Channels) can last a very long time and go much further than what seems likely.
- Bulls will continue to buy below any bar and scale in lower betting on higher prices. The reason bulls are confident they can buy and scale in lower is that the odds favor a bull trend transitioning into a trading range, not a bear trend.
- One issue with today’s rally is the lack of open gaps. This will increase the odds of the channel not lasting all day.
Yesterday’s Emini setups

Al created the SP500 Emini charts.
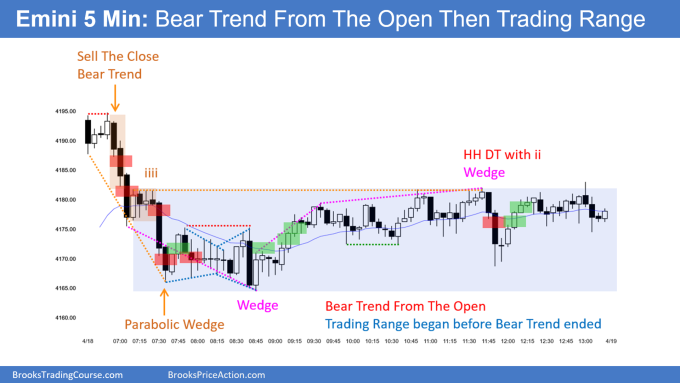
Here are several reasonable stop entry setups from yesterday. I show each buy entry with a green rectangle and each sell entry with a red rectangle. Buyers of both the Brooks Trading Course and Encyclopedia of Chart Patterns have access to a near 4-year library of more detailed explanations of swing trade setups (see Online Course/BTC Daily Setups). Encyclopedia members get current daily charts added to Encyclopedia.
My goal with these charts is to present an Always In perspective. If a trader was trying to be Always In or nearly Always In a position all day, and he was not currently in the market, these entries would be logical times for him to enter. These therefore are swing entries.
It is important to understand that most swing setups do not lead to swing trades. As soon as traders are disappointed, many exit. Those who exit prefer to get out with a small profit (scalp), but often have to exit with a small loss.
If the risk is too big for your account, you should wait for trades with less risk or trade an alternative market like the Micro Emini.
EURUSD Forex market trading strategies
EURUSD Forex daily chart

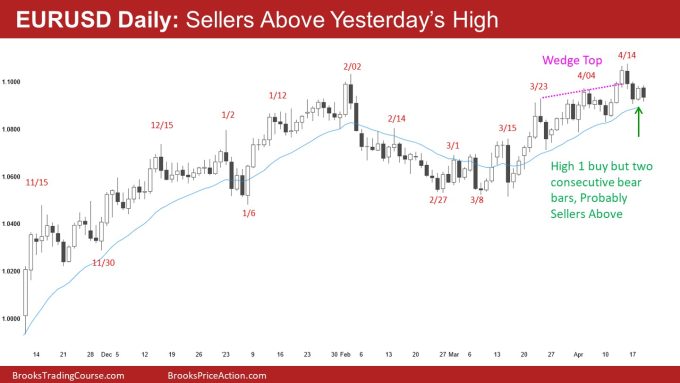
- The EURSUD formed a bull bar yesterday, closing on its high. The bulls see yesterday’s buy signal bar as a breakout pullback buy setup, hoping for a second leg up and a breakout above the April high.
- The bears see a wedge top (see chart above) and expect a test of the April 10th low, the bottom of the third leg.
- Wedge top patterns typically have two legs, and after the two consecutive bear bars (April 14th and April 17th), the odds are there would be sellers above yesterday’s high.
- In general High 1 buy signal bars like yesterday are reasonable to buy signals bars in strong bull trends.
- However, when the market transitions into a trading range, bars like yesterday (April 18th) are generally lower probability buys.
- The bulls know there are probably sellers above and they will look to buy and scale in lower. This means that the odds favor sideways rather than straight down.
- With the market holding above the moving average, the bears need to break below it and ideally get consecutive strong closes below the moving average.
- With the market above the moving average for several bars, the odds are that the bulls will buy the first close below the moving average.
- Overall, the market will probably reach the April 10th low or get close to it. However, traders should expect continued trading range trading, until there is a strong breakout up or down.
Summary of today’s S&P Emini futures price action

Al created the SP500 Emini charts.
End of day video review
Al Brooks EOD video review:
See the weekly update for a discussion of the price action on the weekly chart and for what to expect going into next week.
Trading Room
Al Brooks and other presenters talk about the detailed Emini price action real-time each day in the BrooksPriceAction.com trading room days. We offer a 2 day free trial.
Charts use Pacific Time
When times are mentioned, it is USA Pacific Time. The Emini day session charts begin at 6:30 am PT and end at 1:15 pm PT which is 15 minutes after the NYSE closes. You can read background information on the market reports on the Market Update page.


Your EOD is golden, Al. Thanks in particular for the wrap-up on the weekly chart at the end of the video. Priceless!!
For the past several weeks there have been too many days with low range (20-30 points), what could be the reason for that?
If you look at long term charts you will see a regular cycling between trending and mean reversion and high and low volatility. It’s normal!