Emini bear rally this week after wedge top trend reversal
Updated 6:43 a.m.
The Emini gapped down to below the EMA and into Friday’s trading range. The bulls want an opening reversal up from the close of 2017 and an early low of the day. They know that the probability favors sideways to up for a few days. Yet, they should not have allowed this big of a gap down into Friday’s range. That reduces the chances of a strong trend up on the open.
Since Friday was strong and today is likely to be sideways to up. The odds are against a big bear day. Also, the bottom of Friday’s range will probably be support in any early selloff. The Emini is Always In Long, but it will probably fail to break strong above Friday’s high and the 60 minute EMA in its 1st attempt.
Since the odds are against a big rally or big selloff on the open, the Emini will probably be sideways for the 1st hour. The odds favor 2 – 3 days up. However, since any rally will probably be weak, there can be 2 – 3 hour swings down in the 3 day upcoming rally.
Pre-Open market analysis
As expected, Friday reversed up early. Last week’s selloff followed a wedge top on the daily chart. Therefore, the odds favor a 2nd leg down.
Since a 2nd leg down begins after a rally from the 1st leg down, the Emini will likely go sideways to up for a few days this week. Furthermore, the bears will then sell the rally.
Last week was a big bear outside down bar on the weekly chart. Yet, it had big tails and was in a 4 bar tight trading range. This is simply more tight trading range trading. Last week’s bar therefore increases the chance of another sideways bar this week.
In addition, last week’s range was big. Furthermore, this week will probably open in its middle. Consequently, there is an increased chance that this week will be an inside bar on the weekly chart. There will probably be sellers around last week’s high and buyers near its low.
Wedge top corrections can be complex
While it is possible that Friday was the end of the 1st leg down on the daily chart and that today will start the 2nd leg down, it is more likely that the pullback will last at least 3 days. This is because the wedge on the daily chart lasted about a month.
A 2 legged pullback from a wedge top usually has about half as many bars as the wedge. Therefore, the selloff should last about 10 days. It has gone on for only 4 days. If there is a 2nd leg down starting today, it will not last long enough to make traders believe it has ended.
Instead, a 2nd leg down today would probably still be part of a then more complex 1st leg down. Therefore a selloff today or tomorrow will probably only last a couple of days. In addition, it would then probably lead to a complex pullback and then another complex leg down. The result would be a complex 2 legged pullback that lasts 3 – 4 weeks instead of just 2 weeks.
Overnight Emini Globex trading
The Emini is down 8 points in the Globex market. The odds are that it will trade sideways to up for 1 – 3 more days. Once it retraces about half of last week’s selloff, it will probably then have a 2nd leg sideways to down.
The Emini is currently back into Friday’s 3 hour trading range. This increases the odds of a continuation of that range. Therefore, it will probably have a trading range open today.
Friday’s setups
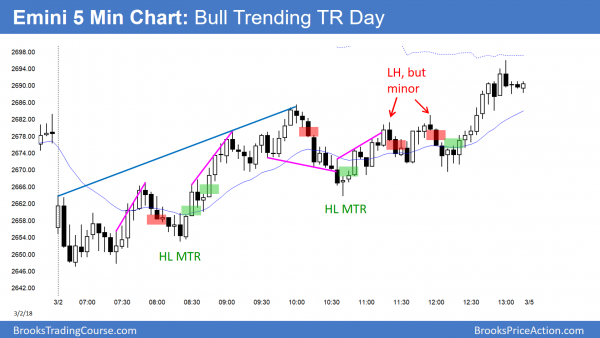
Here are several reasonable stop entry setups from Friday. I sometimes also show limit order entries and entries on the close of bars.
EURUSD weak reversal up from bottom of 2 month trading range
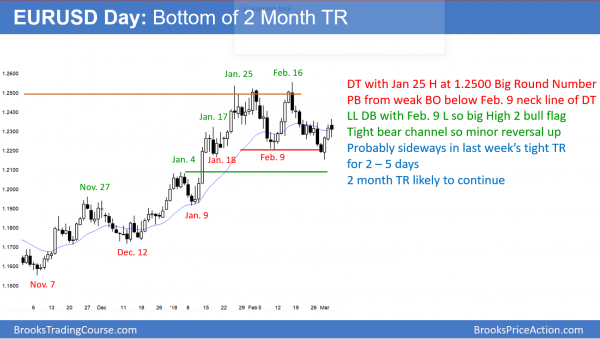
The EURUSD daily Forex chart reversed up from a breakout below the bottom of a 2 month trading range. It is stalling in the 5 day tight trading range of 2 weeks ago.
The EURUSD daily Forex chart has been in a trading range for 2 months. After a failed breakout above the top, it broke below the bottom last week and reversed up. The reversal up had consecutive big bull bars closing on their highs.
This is a sign of strong buying. Yet, today is so far a bear day that overlaps almost all of Friday. Furthermore, it is within the 5 day tight trading range of 2 weeks ago. Therefore, this is not a strong reversal up. Consequently, traders are deciding between this being a pullback from the bear breakout and a reversal up from a failed bear breakout. They need more information, and the odds are that the daily chart will go sideways for several days this week.
The bears will see the developing tight trading range as a bear flag. There will probably be a micro double top, like in the tight range from 2 weeks ago. They will then again try for a strong, successful break below the 2 month range. Since markets have inertia, they resist change. As a result, it is more likely that the bears will fail and the 2 month trading range will continue.
Monthly chart in tight bull channel
The monthly chart rallied strongly over the past year. This makes any selloff over the next several months likely to be minor on the monthly chart. As a result, the best the bears will probably get is a trading range. However, the bottom of that range could be down around the November 1.15 low.
Since the 3 month rally from November had 3 strong bull bars on the monthly chart, the bears would probably need at least a micro double top on that chart to get down to 1.15. This means that the monthly chart will probably go sideways for at least another 2 months.
Bull case on the daily and weekly charts
The bulls hope that the 2 month selloff is a 2 legged pullback in a bull trend (High 2 bull flag). Last week was a buy signal bar on the weekly chart. The buy triggered overnight by going above last week’s high. Yet, last week was a doji. It therefore lacked much buying pressure.
Furthermore, it was in a 6 week tight trading range. While still a bull flag, it is a weak buy signal. Therefore, the odds favor more sideways trading before the bulls will get a strong breakout above 1.25.
The late February selloff on the daily chart was in a tight bear channel. That means that the 1st reversal up will probably be minor. Hence, the 3 day rally will probably go sideways this week rather than straight up. The bears will try to create a bear flag.
Yet, the bulls will then try to get a bull breakout above the bear flag. If they succeed and if the breakout is strong, they will again try to break above 1.25. Since trading ranges resist breaking out, it is more likely that any rally over the next 2 weeks will probably stall above 1.24. Consequently, the trading range will probably continue for at least a couple more weeks.
Overnight EURUSD Forex trading
The EURUSD 5 minute Forex chart has been in a 50 pip range over night after breaking above last week’s high. The 240 minute chart has a Big Down, Big Up pattern. That usually creates Big Confusion and a trading range. Today will therefore most likely be sideways, and day traders will scalp.
Over the next week, if there is a good sell signal near the top of the 200 pip range, the bears will look to swing at least part of their shorts. They hope for a double top bear flag on the daily chart with the high from 2 weeks ago.
In addition, if there is a pullback to below 1.2250 and a good buy setup, the bulls will buy for a 2nd leg up to the middle of the 2 month range.
Summary of today’s S&P Emini futures price action and what to expect tomorrow
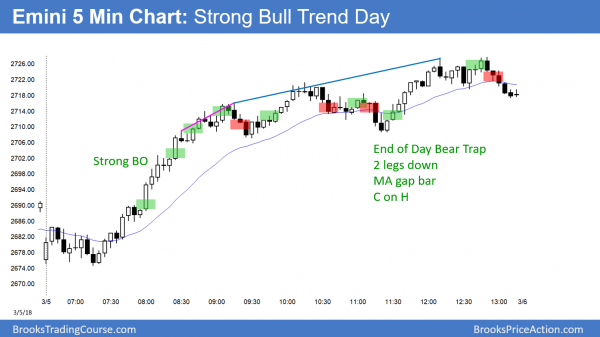
The Emini triggered a buy signal today by breaking above Friday’s high. Today was a strong bull trend day.
Today reversed up on the open from the close of 2017. It was a strong bull trend day. It broke above Friday’s high, which triggered a buy signal on the daily chart. Furthermore, it broke strongly above the 60 minute EMA and the 2700 Big Round Number.
While this might be the start of a rally back up to a new all-time high, the wedge top will probably lead to a 2nd leg sideways to down 1st. Because today was so strongly up, the 2nd leg might be more sideways than down.
Since today had a series of buy climaxes, the bulls will probably be exhausted. This could lead to a trading range early tomorrow.
See the weekly update for a discussion of the price action on the weekly candlestick chart and for what to expect going into next week.
Traders can see the end of the day bar-by-bar price action report by signing up for free at BrooksPriceAction.com. I talk about the detailed S&P Emini futures price action real-time throughout the day in the BrooksPriceAction.com trading room. We offer a 2 day free trial.
When I mention time, it is USA Pacific Standard Time (the Emini day session opens at 6:30 am PST, and closes at 1:15 pm PST). You can read background information on the intraday market reports on the Intraday Market Update page.


If you bought above bar 1 Monday, was the correct stop below bar 68 from Friday rather than bar 1 today?
Al, good morning,
Thank you for the pre-open market analysis. It is especially helpful that you indicated possible duration of the sell off as about 10 days. It is as a lighthouse for those who are in grey fog.