Emini at apex of triangle ahead of Wednesday’s May FOMC
I will update again at the end of the day
Pre-Open market analysis
Today is the last day of April and it therefore affects the monthly chart. At the moment, April has a bull body, but a tail on top. It is a buy signal bar for a 3 bar (month) bull flag in a strong bull trend on the monthly chart. However, each of the bars in the bull flag have prominent tails. That is a sign of complacency. It therefore increases the chance of more sideways trading before the bull trend resumes.
Friday was a pause day after a strong 2 day reversal on the daily chart. The reversal stopped at the top of the month-long trading range. With the uncertainty of Wednesday’s 11 a.m. PST FOMC announcement, the Emini might go sideways into the report.
Even though the daily chart is in a 3 month triangle, the odds favor a bull breakout because the monthly chart is in a bull trend. However, there is no clear sign yet that the trading range is about to break into a trend up or down.
Overnight Emini Globex trading
The Emini is up 7 points in the Globex session. It will therefore probably gap above Friday’s high. But, the gap will probably be small. In addition, the bulls are still unable to break strongly above the 3 week trading range of late March and early April.
While the odds favor the bulls, they need to do more before traders believe that the 3 month correction has ended. Since the today is the last trading day of the month, the bulls want April to be as strong a buy signal bar as possible on the monthly chart. Hence, they will try to get the month to close at its high. That high is currently 2718. It would be a sign of strength if the bulls can close the month at a new high. However, having it close about 2700 would also be a sign of strength.
The bears know that the chance of a big bear bar on the monthly chart is unlikely in April. Since the open of the month is about 60 points below, even a small bear body is unlikely. At a minimum, they want the bull body to be as small as possible. This would make April a weak buy signal bar and reduce the chance that the bull trend is resuming on the monthly chart. Consequently, the bears will try for an early high of the day today, and then a bear trend day. But, they gain little by having a big bear trend day today. They were not strong enough last week to give themselves a meaningful opportunity today. As a result, the odds are against a big bear day today.
Since Wednesday’s FOMC meeting is important, the Emini might simply go sideways until then. The odds therefore favor either a trading range day or bull trend day today.
Friday’s setups
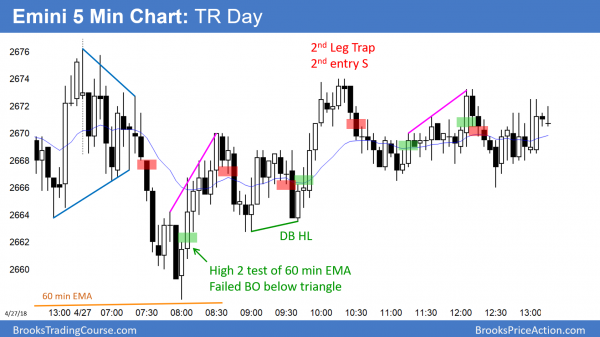
Here are several reasonable stop entry setups from Friday. I sometimes also show limit order entries and entries on the close of bars.
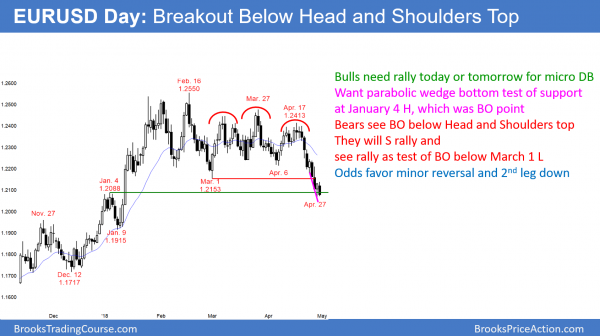
EURUSD breakout below head and shoulders top
The EURUSD daily Forex chart has broken strongly below a 4 month trading range. It is now testing the breakout point of the January strong rally. The 3 week selloff is strong enough so that bears will sell the 1st rally.
The bear breakout is in a tight channel and is forming a 3rd leg down. April 24 was the 1st leg. This is a parabolic wedge bottom. The bulls hope the selloff is just a sell vacuum test of support. They know that a parabolic wedge is a sell climax. Therefore, they hope for a sharp reversal up to above the February top of the range. Yet, they have only a 30% chance of being right at the moment. A reversal up from a tight bear channel is usually minor. That means that it has a 70% chance of forming a bear flag or becoming a bull leg in a trading range. Consequently, the bears will sell the 1st 150 – 200 pip rally, confident of a 2nd leg sideways to down.
Overnight EURUSD Forex trading
Friday was a strong bull trend day on the EURUSD 5 minute Forex chart. The bulls will try to form a double bottom with Friday’s low. If today or tomorrow falls below that low, the bulls will buy the bear breakout. This is because it would be the 3rd leg down in a tight bear channel. They know that the odds favor a bounce after a parabolic wedge selloff. The daily and 60 minute charts are in bear trends. Therefore, the bears can sell for any reason at any time. Because the chart is now testing minor support and the overnight selloff is the 3rd leg down, the math is better for bears who are day trading to sell a 50 – 150 pip pip rally. They will begin to scalp more until there is a rally to around 1.2200. That is around the April 6 low. They will sell there for a swing down to the low of the bear leg, which is currently Friday’s low.
Summary of today’s S&P Emini futures price action and what to expect tomorrow
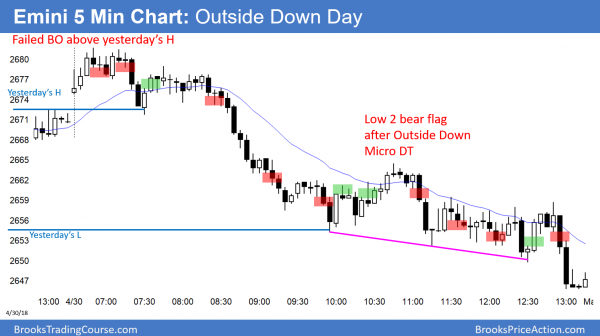
Today was an outside down day, and it closed near its low. It is therefore a sell signal bar on the daily chart. However, it is in the middle of a 3 month trading range and therefore a low probability sell setup.
Today was the last trading day in April. It was an outside down day that closed near its low. On the monthly chart, April is a bull doji and therefore it it has prominent tails. Hence, it is not a strong buy signal bar for May.
On the daily chart, today was an outside down day. Since it closed near its low, it is a sell signal bar for tomorrow. However, selling below a big bar on the daily chart in the middle of a 3 month trading range is a low probability strategy. In addition, Wednesday is an FOMC announcement day. Tomorrow therefore has an increased chance of being mostly neutral going into the report.
See the weekly update for a discussion of the price action on the weekly candlestick chart and for what to expect going into next week.
Traders can see the end of the day bar-by-bar price action report by signing up for free at BrooksPriceAction.com. I talk about the detailed S&P Emini futures price action real-time throughout the day in the BrooksPriceAction.com trading room. We offer a 2 day free trial.
When I mention time, it is USA Pacific Standard Time (the Emini day session opens at 6:30 am PST, and closes at 1:15 pm PST). You can read background information on the intraday market reports on the Intraday Market Update page.


Hi Al, I have a question on the 3rd sell entry on the chart, if I were to short it, should I consider this trade as a scalp (potential TR) or shall I bet that it is in a bear channel and hold it for a swing down?
Selling at the bottom of a tight trading range, especially just above a higher low and the low of the day, is a low probability bet and therefore a swing trade.
I think last Friday’s low was at $2757.75
Why is it shown around $$2654.?
I like to fix my mistakes, but I am not seeing 2654 in this post. Friday’s low was 2657.75, not 2757.75 so I assume that was a typo in your question. If I wrote 2564 somewhere, you are correct about it being the wrong number.
Al, thank you very much for your reply.
The blue horizontal line on the chart labeled “Yesterday’s L” is touching 41 low, which is $2654.25
I assume it slipped there from its correct position by accident.
The reason I paid attention to it was because if Yesterday’s Low is higher than is shown on the chart, right under 40, then it’s really not a good place to sell the close right at support?
Thank you again very much for your time.
Al,
Is there any difference, subtle or otherwise, between H2’s/L2’s and 2nd entries or are they one and the same in price action trading.
Thanks in advance for your reply.
Bob
a H2 or a L2 is always a 2nd entry, but some 2nd entries are not very good looking H2s or L2s. When that is the case, I use another term, like a double top or bottom.