Emini 60 minute parabolic wedge buy climax below March high
I will update again at the end of the day.
Pre-Open market analysis
Yesterday had a small range and was sideways. The 3 day rally is losing momentum now that it is near the top of the 6 month range. This reduces the chance of a big bull trend day today. In addition, there is a parabolic wedge top on the 60 minute chart. The odds favor a 1 – 3 day pullback this week. Since there is a 6 bar bull micro channel, there will probably be buyers not far below yesterday’s low. The selloff might be a test of the neck line of the head and shoulders bottom on the 60 minute chart. That is just below 2750.
A gap down today will create a 1 day island top. But, island tops and bottoms are fairly common in trading ranges. They are not major reversal patterns. However, if there is a gap down, there would be an increased chance of a few days down to test the breakout above the 60 minute head and shoulders bottom. Therefore, there would be an increased chance of a bear trend day.
Overnight Emini Globex trading
The Emini sold off about 30 points overnight, but is currently down only 14 points. After shrinking bull bodies for 3 days on the daily chart, the Emini was likely to pull back today. It will probably gap below yesterday’s low, creating a one day island top.
After 4 consecutive bull trend days on the daily chart, the bears will have a hard time getting a strong reversal down. They will probably need at least a micro double top. Therefore, despite the big overnight selloff, today will probably not be a big bear trend day. The pullback will probably be 2 – 3 days of sideways to down trading. But, then the bulls will likely buy again for at least a test of yesterday’s high.
Today’s open will be important late in the day. If there is a bear trend today, the bulls will try to create a reversal back up to above the open. They want the bull trend to resume. Therefore, they would like today to be a bull reversal day on the daily chart.
The bears hope that the gap down will be the start of a Trend From The Open Bear Trend Day. If they get it, the selloff will probably only be a breakout test of the 2740 neck line of the 2 week head and shoulders bottom. There will be buyers there.
Yesterday’s setups
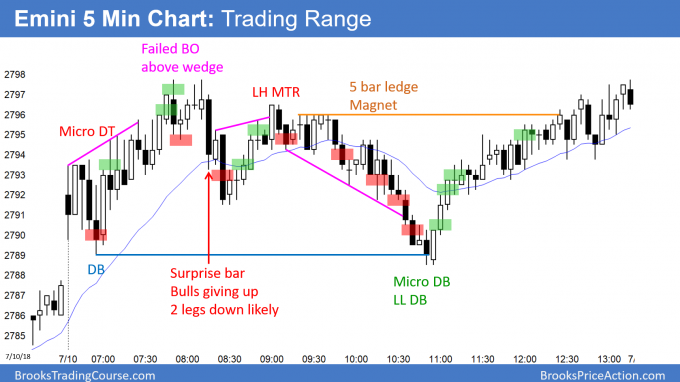
Here are several reasonable stop entry setups from yesterday. I sometimes also show limit order entries and entries on the close of bars. My goal with these charts is to present an Always In perspective. If a trader was trying to be Always In or nearly Always In a position all day, and he was not in a position at the moment, these entries would be logical times for him to enter.
EURUSD Forex bull flag in bear rally
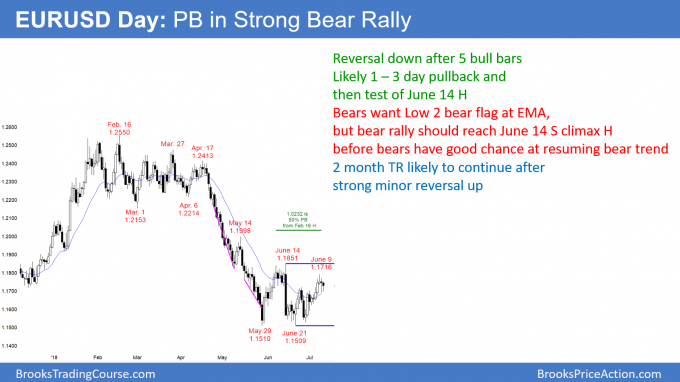
The EURUSD daily Forex chart pullback over the past 2 days after 5 bull bars. This is a bull flag in a bear rally. The rally should test the June 14 sell climax high.
The EURUSD daily Forex chart pulled back over the past 2 days after 5 consecutive bull trend bars. That represents good momentum up. In addition, the June 14 sell climax high of 1.1851 is a strong magnet. Consequently, the rally will likely continue this week and reach the target next week.
Once there, the bulls will take at least partial profits. Also, the bears will sell, hoping for a double top with that June 14 high.
One more push up from this 2 day bull flag would be the 3rd push up from the June 28 low. That would be a wedge channel after the 3 day spike up that began June 21. Since that would create a Spike and Channel bull trend, and the channel would be a wedge, traders would expect a couple legs sideways to down for a week or two.
Therefore, the June 14 high is a good candidate for an initial top to the 2 month trading range. After a pullback from that level, the bulls will try for a breakout above. They then want a test of the May 14 high and 1.2000, which is likely within a couple of months. However, the bears want the bear trend to resume from a double top with the June 14 high.
At the moment, it is more likely that the low for the next couple of months is in and that the trading range will last for at least another month. Its top will probably be above the June 14 high.
Overnight EURUSD Forex trading
The EURUSD 5 minute chart has been in a 50 pip range overnight. It is forming a double bottom with yesterday’s low. However, the repeated up and down legs mean that the 60 minute chart is in a trading range.
There is no sign yet that the 2 day trading range is about to end. But, if today closes near its high, there would be a 2 day micro double bottom on the daily chart. Since a 3rd leg up from the June 28 low is likely, the rally will then probably resume up to 1.1850 at the June 14 high.
The bulls will buy pullbacks to today to try to create a credible bull flag on the daily chart. The bears will look for 10 pip scalps. They know that the odds of a swing down are small until after the 4 week rally reaches 1.1850.
Summary of today’s S&P Emini futures price action and what to expect tomorrow
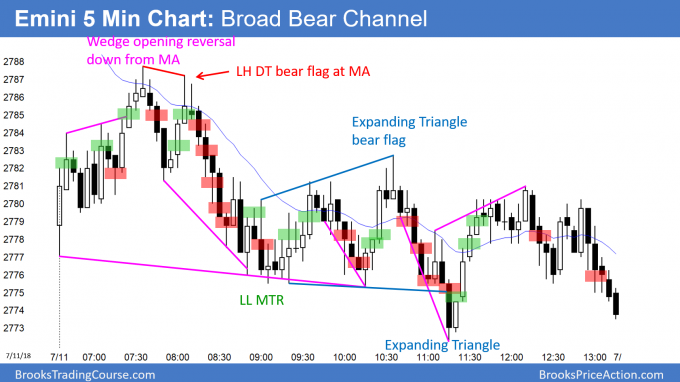
Here are several reasonable stop entry setups for today. I sometimes also show limit order entries and entries on the close of bars. My goal with these charts is to present an Always In perspective. If a trader was trying to be Always In or nearly Always In a position all day, and he was not in a position at the moment, these entries would be logical times for him to enter.
The Emini gapped down and formed a 1 day island to on the daily chart. It sold off in a broad bear channel, but spent most of the day around the open. Since there is a parabolic wedge top on the 60 minute chart, there will probably be at least a small 2nd leg down this week.
Today is the 1st pullback in a 6 day bull micro channel. It is therefore a High 1 bull flag. But, since lower prices are likely because of the wedge top on the 60 minute chart, the daily buy signal is weak. This week’s gap up will probably close tomorrow.
See the weekly update for a discussion of the price action on the weekly candlestick chart and for what to expect going into next week.
Traders can see the end of the day bar-by-bar price action report by signing up for free at BrooksPriceAction.com. I talk about the detailed S&P Emini futures price action real-time throughout the day in the BrooksPriceAction.com trading room. We offer a 2 day free trial.
When I mention time, it is USA Pacific Standard Time (the Emini day session opens at 6:30 am PST, and closes at 1:15 pm PST). You can read background information on the intraday market reports on the Intraday Market Update page.


