daily island bottom and weekly ioi breakout mode candlestick pattern
Updated 6:50 a.m.
The Emini opened in the middle of yesterday’s range and not at support or resistance. Therefore neither the bulls nor the bears were able to demonstrate strength on the open. Most days over the past several weeks were sideways for most of the day. Hence, the unremarkable open makes today likely to again have a lot of trading range trading.
The moving average is only 2 points above. In addition, yesterday’s low and the 60 minute moving average are only 2 points below. Because of the early sideways trading and nearby support resistance, today has an increased chance of an early trading range. This is a Limit Order Market. Most traders should wait for a strong breakout, or a failed breakout and a reversal.
Pre-Open Market Analysis
The Emini gapped up on Friday and therefore created an island bottom bull flag. Because it did not break above the island top of 2 weeks ago, some bears are holding short. Hence, they are betting that the 5% correction began with last week’s top. While they might be right, the Emini is holding above the moving average. Furthermore, it is in a bull trend. Therefore, the odds favor higher prices.
ioi on weekly chart
Last week was formed an inside bar after an outside bar on the weekly chart. This is therefore an ioi setup. While it is a bull flag, the rally of the past 8 weeks was weak. Furthermore, the Emini never tested the August high. Therefore, the odds of a strong rally from here are small. Hence, a bull breakout above the ioi will probably not go far.
An ioi is a breakout mode pattern. Yet, the weekly chart has had 5 consecutive bull trend bars. In addition, last week was a bull bar. That is therefore a weak sell signal bar for bears hoping that the ioi is the start of a bear trend. As a result, it is more likely that bulls will buy below last week’s low.
Overnight Emini Globex trading
The Emini is down 6 points in the Globex session. It might therefore open below Friday’s low. As a result, Friday would become a 1 day island top. When last week created its island top, I wrote that island tops are often followed by island bottoms and other island tops. This is trading range price action on the daily chart. Yet, the odds are that the Emini will test the August high within the next couple of months. That is about 100 points lower.
A 2nd island top has a higher chance of success than the first. Hence, traders will therefore be more ready to sell and hold short if a selloff begins. This would therefore be different from what they’ve done for months when they bought every reversal down.
If today gaps below yesterday’s low and there is strong selling for 2 – 3 days, the odds will begin to favor the start of the 5% correction. Because the bears need at least one big bear trend bar to make traders begin to believe in a selloff, traders are ready to sell. That one big bear bar would start to run stops below all of the minor higher lows of the past 2 months. The selloff therefore could be fast.
Without that big bear trend day, the odds favor sideways and higher prices. Yet, it is more likely that the Emini has the 5% correction before reaching the measured move targets between 2340 and 2375.
EURUSD Forex Market Trading Strategies
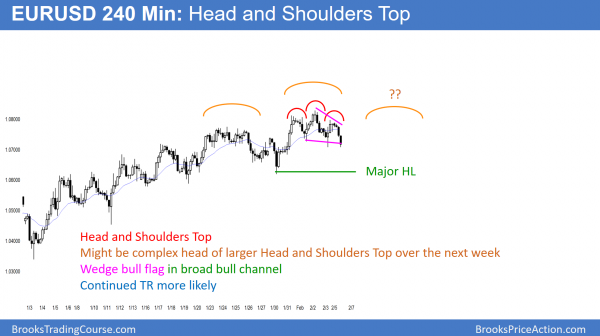
The EURUSD 240 minute chart is a broad bull channel. Yet, it has been sideways for 3 weeks. As a result, there is both a top and a bull flag. This small Head and Shoulders Top might become the head of a larger Head and Shoulders Top over the next 2 weeks.
After a weak rally in a bear trend, the EURUSD Daily chart has been sideways for 3 weeks. Because last week was a big outside bar, this week might be an inside bar. Hence, this week might set up an ioi breakout mode pattern for next week.
Since the EURUSD is sideways after a rally, there is always both a bull flag and a topping pattern. The bears see a Head and Shoulders Top on the 60 and 240 minute chart. But, the bulls see a wedge bull flag. Since a trading range resists change, the odds are that neither pattern will lead to a successful breakout. Hence, it is more likely that the range will continue. Furthermore, another top and bull flag pattern will evolve.
Overnight EURUSD Forex trading
The EURUSD Forex market sold off overnight. Yet, it is still in its 3 weeks trading range. Therefore, the odds are that it will stabilize here around Friday’s low. While the overnight momentum was good, legs up and down within trading ranges are often strong.
Until there is a breakout, they are more likely to reverse. Because the momentum down was strong overnight, the bulls will probably need to first stop the selling. As a result, the best the bulls will probably get today is a trading range.
While the bears want the selling to continue today, the EURUSD bounced here on Wednesday and Friday last week. The odds are against a successful breakout below the neck line of the Head and Shoulders top. A trading range is more likely. Yet, if the overnight trend continues today, the next support is last week’s low, about 100 pips lower.
Summary of today’s S&P Emini futures price action and what to expect tomorrow
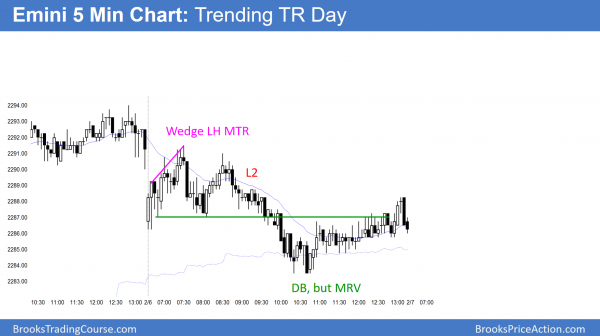
The Emini sold off first from a wedge lower high and then from a double top at the moving average. It found support at the 60 minute moving average, just above Friday’s low. As a result, it was a Trending Trading Range Day.
The Emini formed a small Trending Trading Range Day today. It therefore increases the odds of a lot of trading range price action tomorrow. The bears want a gap down, which could create a 2nd island top. Since 2nd signals have higher probability, a gap down could lead to a trend day. The bulls want the bull trend on the daily chart to continue to the 2340 – 2375 measured move targets.
See the weekly update for a discussion of the price action on the weekly candlestick chart and for what to expect going into next week.
Traders can see the end of the day bar-by-bar price action report by signing up for free at BrooksPriceAction.com. I talk about the detailed S&P Emini futures price action real-time throughout the day in the BrooksPriceAction.com trading room. We offer a 2 day free trial.
When I mention time, it is USA Pacific Standard Time (the Emini day session opens at 6:30 am PST, and closes at 1:15 pm PST). You can read background information on the intraday market reports on the Intraday Market Update page.


