Buy climax so Emini is ignoring Republican tax cuts
Updated 6:49 a.m.
While the Emini had a small gap up, it closed on the 1st bar. In addition, the 1st bar was a doji bar, which means that there is not yet much energy. Since the Emini is breaking above the top of a 5 day bull channel on the 15 minute chart, the odds are that the breakout will fail within about 5 bars. That means within an hour or so.
Because today traded above last month’s high is a monthly buy climax, traders need to be aware that the Emini might not get much higher and then trade below last month’s low. That would create an outside down bar and a 2 bar reversal. The bears need a reversal to begin a 1 – 3 month pullback, and they will try to get that. This means that they will try to get an early high today and a trend down.
The bulls want last month’s rally to continue. Yet, if they get a 20 – 30 point rally, it might reverse down to below today’s open by the end of the month and create a reversal bar on the monthly chart.
So far, today has had 2 small dojis in the 1st 3 bars. This reduces the odds of a strong trend day. In addition, it increases the chances that any trend day will either be weak or spend a lot of time going sideways, like Friday. If there is a strong series of trend bars up or down, then traders will look for a strong trend. Without that, traders will look for at least one reversal today. As I said, the Emini is deciding between a 2 bar reversal, a reversal bar, and a strong bull trend day on the monthly chart. This weak open increases the odds of an early high. However, the early small bars increase the odds of a mostly quiet day.
Pre-Open market analysis
On Friday, the Emini broke above Thursday’s buy signal bar on the daily chart. It rallied to another all-time high on Friday. While there is no sign of a top, the 11 month bull micro channel on the monthly chart makes a pullback likely soon. Until there is a top, there is no top. Therefore the odds favor at least slightly higher prices.
Because last month was a strong bull trend bar on the monthly chart, the odds favor at least slightly higher prices this month. However, since the monthly chart now has a 12 bar bull micro channel, which is extreme, the odds are that there will be a pullback within a month or two. There is therefore a higher probability that this month will either be an inside bar on the monthly chart or a bear reversal bar.
Gap up?
Friday closed at its high in a strong rally on all higher time frames. This means the Monday might gap up on the daily, weekly, and monthly charts. When there is a gap up in a strong bull trend, the bulls will try to keep the gap open. Therefore, if there is a selloff, the bulls will buy just above last week’s high.
In addition, last week’s rally was strong. Consequently, the bulls might not give up even if there is a strong early selloff to below Friday’s high. This means that they might create an Opening Reversal up from even below last week’s high.
Buy climax so increased risk of reversal
Whether or not there is a gap up, the bears will try to create a reversal this month. If they fail to get a reversal down on the open, they will try again on a rally above last month’s high. This is even true if the rally is extremely strong. That could result is a bear reversal bar on the monthly chart.
The monthly chart is in an extreme buy climax. This means that most traders are buying because the Emini is going up strongly, not because they think it is cheap. As a result, if it stops going up strongly, they will be quick to sell out to avoid a loss. This often results in a sharp reversal down from a buy climax. Yet, since the monthly chart is so strongly up, the odds favor a 1 – 3 month bull flag and not a bear trend.
Overnight Emini Globex trading
The Globex chart is up around 3 points. This means that today might have a gap up on the daily, weekly, and monthly charts. Since the gap would be coming late in a bull trend on the weekly and monthly charts, it would probably be an exhaustion gap if it were to stay open. It would probably close either today or within a couple of weeks.
The past week has had reasonable swings up and down. Even though Friday was mostly in a tight trading range, the odds favor at least one swing up or down today. In addition, a gap up would increase the odds of a swing up or down. If there is a gap up, it will probably be small. That means that there is not much energy. Consequently, the odds would be against a big trend day.
Even though the higher time frames are extremely strongly up, they are all in buy climaxes. This increases the chances of a big bear trend day at any time. Day traders should be prepared for a surprisingly big move up or down. However, since a big move would be a “surprise,” that means that today will probably be more of a hesitation day after last week and month’s big rallies, and not be very big.
Friday’s setups
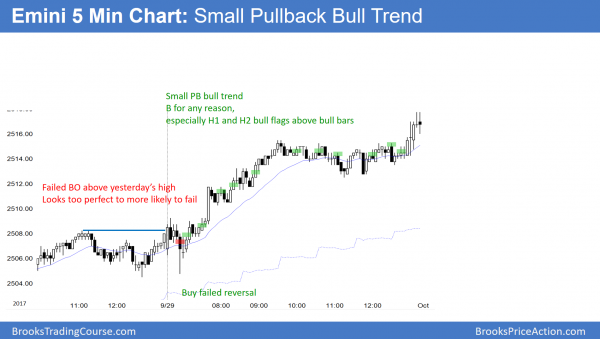
Here are several reasonable stop entry setups from Friday. I sometimes also show limit order entries and entries on the close of bars.
EURUSD Forex market trading strategies
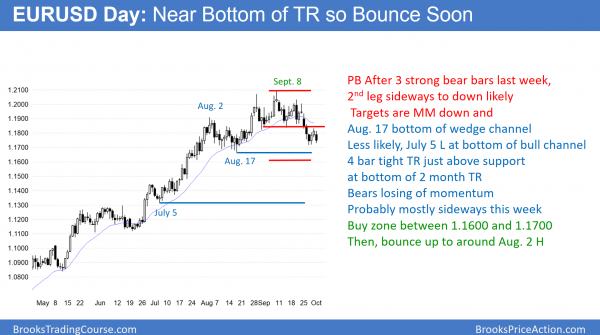
The EURUSD daily Forex chart is having a small 2nd leg sideways to down from last week’s 3 bear bar break below a head and shoulders top. After 2 bull bars, the bears are losing momentum at support a the bottom of a 2 month trading range.
The EURUSD daily Forex chart broke below the neck line of a small head and shoulders top last week. The 3 bear bars made at least a small 2nd leg sideways to down likely. The past 2 days met that minimum goal.The bulls hope that the selloff is simply a big 2 legged pullback from the September 8 high. In addition, they want a higher low above the August 17 major higher low.
However, the selloff was strong enough to make a trading range more likely than a bull flag. Since trading ranges typically disappoint bulls and bears, the odds favor sideways for at least a couple of weeks. Furthermore, the legs usually go beyond support and resistance. Therefore, the odds favor a break below the August 17 major higher low before much of a rally. That means that the buy zone is between 1.1600 and 1.1700.
In addition, that rally will probably go above the September 14 head and shoulders top breakout point before reversing down. It will likely go up to around the August 2 high, around 1.2000. That would therefore be the sell zone. If it turns down from around there, the pattern would become a bigger, nested head and shoulders top where the small September top is the head of the bigger pattern.
Overnight EURUSD Forex trading
The 5 minute chart bounce up 30 pips from around last week’s low. The chart is in a 4 day tight trading range after last week’s bear breakout. When that happens, there is usually a 2nd leg up to the 20 day exponential moving average. It would probably test Friday’s high and 1.1850 in a 2 – 5 day rally. Then the bears would sell again. That would create a Low 2 bear flag.
Since the odds favor a break below the August 17 major higher low before a rally goes very far up, traders will sell rally. This would trigger the Low 2 bear flag. However, the daily chart is near support. Bulls will buy around and especially below the August 17 low.
Strong bull trend on the weekly chart
The weekly and monthly charts are in strong bull trends. The odds are therefore against a trend reversal down without at least a small double top on the monthly chart. Consequently, while the odds favor slightly lower prices over the next few weeks, they then favor a 200 – 300 pip bull leg in the trading range.
Since the daily chart is now in a trading range, traders will begin to expect smaller swings and lots of reversals. Therefore, day traders will probably be mostly scalping. However, they will look for a swing up if there is a break below the August 17 low. In addition, they will look for a swing down from around 1.200.
Summary of today’s S&P Emini futures price action and what to expect tomorrow
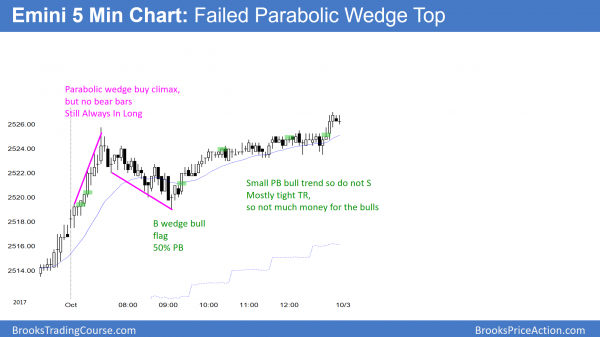
The Emini began with an 11 bar bull micro channel (no pullbacks), and it had no bear bars. That is strong buying and it made a bear trend unlikely. After a deep pullback, it rallied in a very weak small pullback bull trend.
While it is still possible for October to reverse down and trade below the September low, it is unlikely. That would be an outside down bar on the monthly chart and the 1st pullback in 12 months. However, because this is the 12th month without a pullback and that is very rare, the upside is probably limited to another 1 – 2 months before there is a 1 – 3 month pullback of 100 – 200 points. There is no top yet, and therefore the odds continue to favor at least slightly higher prices.
See the weekly update for a discussion of the price action on the weekly candlestick chart and for what to expect going into next week.
Traders can see the end of the day bar-by-bar price action report by signing up for free at BrooksPriceAction.com. I talk about the detailed S&P Emini futures price action real-time throughout the day in the BrooksPriceAction.com trading room. We offer a 2 day free trial.
When I mention time, it is USA Pacific Standard Time (the Emini day session opens at 6:30 am PST, and closes at 1:15 pm PST). You can read background information on the intraday market reports on the Intraday Market Update page.


…to comment Kent post above my opinion would be, frustration of bull market is building in us 🙂
What I found personally limiting with end of the day review is that all entries marked on the chart are profitable.
No wrong side entry, no 2nd reentry, no sl hit.
Just perfect 100% trading in the market, which 80 % the time has 50-50 prob. of the move.
I am not criticizing, I just find it limiting, applying constantly 100 % win ratio to the environment, where prob. is most of the time 50 %.
It just does not feel real.
I have given a lot of thought to what I should put on those charts every day. I am sure you are aware of my many choices. I could easily describe 40 trades a day with many being losers. However, the chart would be so crowded that it would be impossible to read. Furthermore, I am already working long hours, and I cannot spend that much time doing more. I settled on just showing reasonable entries that are the type beginners should be trying to trade.
No one is going to take all of them. However, traders should try hard to see as many as possible as they unfold because that will give them the best chance at making a living as a trader. If you notice, there are many trades that I show where a trader would either lose a little or not make much. Yet, the setups are still reasonable. My goal in showing these trades is to try to train traders to look for setups like these. If you study these charts carefully, you would conclude that the setups are reasonable, and that other possible setups that I did not show are not nearly as reasonable.
After 8 years of learning from you Al I fully understand what you wrote.
Of course you can not spent hours writing here all trades after the market closes, when you already spent a day commenting in the chat room and traded your own account for living.
When I recognize your tiredness at the end of the trading session as your voice becomes deeper and you still answer patiently all questions and even commit yourself to write review on web every single day you certainly deserve respect of us all.
There is a huge gap of experience, psychological resistance and money management between you Al and the rest of us, over those years and I feel filtering best set entries shows only 1/3 of the trade.
That`s all, hope you do not mind my comment.
Hi Mr. Brooks
Last week you wrote that there in prob. 10 days the pullback would beginn!
In this weekends update with headline “Emini traders believe 2500 buy climax trumps republican tax cuts” and you argued for only 25 % prob. for a breakout
above the bull canal etc.
And now today that the upside is limited 1 – 2 month before the pullback!
I am very confused in how to interpret all this various signs and signals you are giving.
Best Regards
Kent Johansen
I totally understand the anxiety that someone can feel when the market does not behave like it typically behaves. Thirty years ago, I used to get ripped up inside when it happened. Now, I look and say, “Look at that. The market hasn’t done this in a long time. That’s interesting.” I am never emotionally attached to any opinion and just accept what the market is doing. What it is currently doing is unusual. That means the odds of this happening are small, and the odds of it continuing much longer are even smaller.
I assess the market based on how it typically behaves. However, no matter how extreme a trend is compared to prior trends, sometimes it will continue further and become even more extreme. This is an example. I have been writing for 6 months that the Emini would probably correct 100+ points near-term, but then go higher. Yet, it has continued higher without correcting 100 points.
I cannot buy for an investment up here because the Emini only rarely gets this overbought. The last time was 14 years ago. The time before that was 22 years ago. There have been dozens of times since then that the Emini rallied strongly for 20 weeks. Those times all looked like the 1st 20 weeks of this rally. Only once in the 19 year history has it ever been this overbought. At that time, it then corrected 10% in a 10 month tight trading range. Should I assume that this time will get even more overbought than the most overbought it has ever been? In my 30 years of trading, I believe that it a losing strategy. However, I understand the anxiety that a person can have when something this unusual is unfolding.
Because this is a momentum driven market and not a value driven market, there is a greater risk of a very deep, fast selloff of 10% or more. If that were to happen, everyone would forget how they felt during the endless rally. Instead, they would begin to worry that the market might sell off 50%, like it has done several times in the past 30 years. For me, even if it were to sell off 50%, I would say that same as I am saying now: “Look that. That’s interesting. It hasn’t sold off this far this fast in at least 10 years.” I trade what is in front of me, not what I hope or expect will soon be in front of me. And I just accept it and never feel anxious.