Bull flag candlestick pattern coming soon: Updated 6:50 a.m.
The Emini opened with a big gap up at the top of the 60 minute wedge bull channel. It also tested a measured move up from yesterday’s range. It reversed down over the 1st several bars and is Always In Short. Because the bear bars had prominent tails, the odds are that the initial selloff will be a bear leg in a trading range.
When there is a big gap, there is often a strong move up or down for 5 – 10 bars, and then the Emini goes sideways for a couple of hours. At that point, it decides between trend reversal down and trend resumption up. The big tails below the bear bars make a trading range likely over the next 2 hours. While a trend up or down can begin at any time, day traders will mostly scalp until there is more evidence that a strong trend has begun.
The odds of a bull trend day are small after a series of bear bars in an overbought market. While today could be a bear trend day, it will probably have at least a couple hours of trading range price action because of this early hesitation.
Bull flag candlestick pattern coming soon
S&P 500 Emini: Pre-Open Market Analysis
The Emini has not had more than a brief pullback in the current 160 point rally. Overbought markets can become much more overbought than what beginners think is possible. Yet, they usually have pullbacks along the way. The daily chart of the bond market at the end of last week is an example.
Wide stops create pullbacks
Theoretically, the stop for the bulls is below the bottom of the most recent bull leg. That is the July 6 low of 2065.75 and it is about 100 points below. An institution needs to control risk. Once a stop is very far below, the risk begins to become unacceptable. The institution needs to reduce its risk. It can by puts or it can hedge with pairs trades. Most of all, it reduces its position size.
If many institutions begin to take partial profits, the market begins to pull back. They then wait to see if the bears can create a deep pullback. If the bears cannot, the institutions buy the pullback and their buying creates another leg up. They then put raise their stops to below that new bull leg and therefore have less risk.
Wedge top on 60 minute chart
There is no obvious resistance on the daily and weekly charts here. This is the top of a 60 minute wedge bull channel, using the July 1 and 12 highs. Because the channel is tight, any reversal down will probably be minor.
As a result of the tight channel lasting more than 40 bars, it is extreme and therefore climactic. Hence, it increases the chances of a sharp reversal. However, the risk is small. Institutions will probably reduce their positions within the next few days, and this will probably create a 20 – 40 point pullback that will last at least a couple of days. However, bulls will probably buy the pullback. The bull flag would then be followed by another leg up, which would be at least a one bar.
Globex market
The Emini is up 16 points in the Globex market. As a result, it will probably have a big gap up on the open. Whenever there is a big gap up, there is an increased probability of a trend day in either direction. The Emini had a buy climax overnight and has been sideways for 3 hours. The bulls want trend resumption up and the bears want trend reversal down. The 3rd possibility is that today is mostly a small trading range day, like the past 3 days. Day traders will watch the 1st several bars for clues to what the day will be.
Forex: Best trading strategies
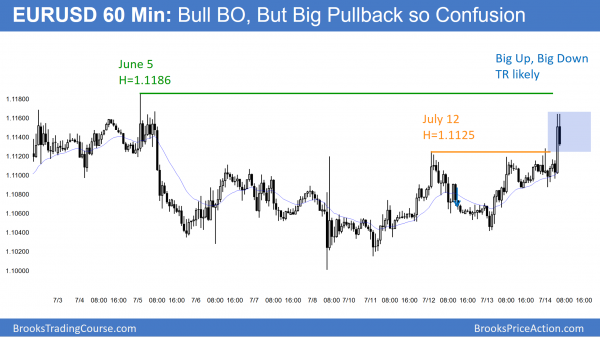
The EURUSD 60 minute Forex chart broke strongly up 2 hours ago, but the pullback has been big as well. This is a Big Up, Big Down pattern. It disappoints the bulls and creates confusion. Confusion is a hallmark of a trading range, and that is what will likely develop over the next couple of hours.
The EURUSD daily Forex chart is still in its 4 week trading range. The bulls see yesterday’s rally as the move up from a higher low major trend reversal. The bears see it as part of a bull leg in a month-long bear flag. When both the bulls and bears have reasonable arguments, traders conclude that they are equally strong and that the market is in a trading range.
While there might be one more leg down to below the June 24 sell climax low, bulls will probably buy the bear breakout. This is because the daily chart is at the bottom of a 4 month trading range and 80% of trading range breakouts fail. The bears need a strong break below the March low and even the December low before traders will believe that the bear trend has resumed.
Forex scalping while waiting for the breakout
Until then, most days will have a lot of trading range price action and Forex day traders will continue to mostly scalp. See my post yesterday for examples of the kinds of entries day traders are taking for their scalps.
European session
The EURUSD rallied 60 pips about an hour ago. This is a buy vacuum test of the top of the month-long trading range. It has pulled back about 50% over the past 30 minutes. The bulls want a 2nd leg up and the bears want a reversal down.
This is a Big Up, Big Down candlestick pattern. It is a sign of confusion. As a result, it usually leads to a trading range and a Breakout Mode setup. The bulls want a bull flag and 2nd leg up. The bears want this to be a climactic top and the start of a swing down. The location is good for the bears and the momentum is good for the bulls. Each has a 50% probability. The trading range usually lasts at least an hour or two, but it might last all day. Traders will be ready to swing trade, but will probably scalp over the next hour or two. As a result of most days over the last month being trading range days, the odds are that today will end up as mostly a trading range day.
Summary of today’s S&P Emini futures price action and what to expect tomorrow
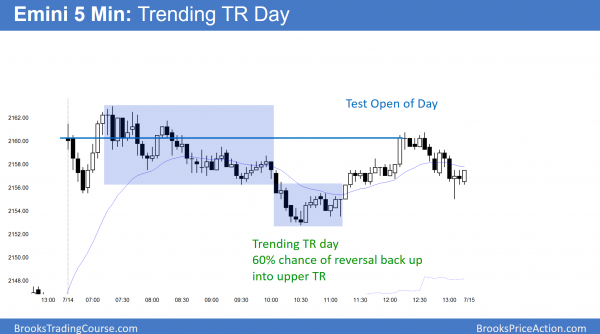
The Emini gapped up, but went sideways for most of the day. It formed a trending trading range day. As usually happens, there was a late bull breakout of the lower range, and the Emini traded back up into the upper range.
The Emini today made another all-time high. Like the past 3 days, the range was small and most of the trading was limit order scalping. While the 60 minute channel has been in a tight bull channel for more than 20 bars, which is a type of buy climax, there is no top yet. Yet, institutional bulls will probably take partial profits over the next few days to reduce their risk. Their stop is so far below that maintaining a full position results in more risk than they want.
See the weekly update for a discussion of the price action on the weekly candlestick chart and for what to expect going into next week.
Traders can see the end of the day bar-by-bar price action report by signing up for free at BrooksPriceAction.com. I talk about the detailed S&P Emini futures price action real-time throughout the day in the BrooksPriceAction.com trading room. We offer a 2 day free trial.
When I mention time, it is USA Pacific Standard Time (the Emini day session opens at 6:30 am PST, and closes at 1:15 pm PST). You can read background information on the intraday market reports on the Intraday Market Update page.


Hi Al, I interpreted today’s price action as a LH MTR (bar 22 entry) and then a bear BO of bear ch failing and rallying to the trend line and then forming a wedge and a DT.
Does this seem rational to you?
Thanks.
I agree with all of that. I thought that it was likely to behave like a Trending TR Day, which it did.
hello al,
first off, thank you for the generous contribution of your time and insights .. i have learned much from studying you closely the past few months.
i have a couple general questions i’m curious about regarding your trading style.
do you carry positions overnight .. or are you primarily in the market and out of the market each day?
do you trade /es outside of cash market hours? i have noticed /es can often move nicely before the cash open at 930et and wondered how you view this? on a related note, overnight /es highs/lows/trendlines etc seem to frequently be relevant during the cash session, do you pay attention to that at all?
I rarely hold the ES overnight, although I do hold stock and option positions.
When I was your age, I would trade anytime, and I used to regularly trade starting around 5 am. Now, I only trade NYSE hours. I only use the day session chart for trading. Go to this link and scroll down.
The Emini opened with a bit gap up at the top of the 60 minute wedge bull channel.
Where on the 60 minute chart does this wedge begin and end? Tks.
Please read above. The 1st 2 legs up were July 1 and 12.