Market Overview: Nifty 50 Futures
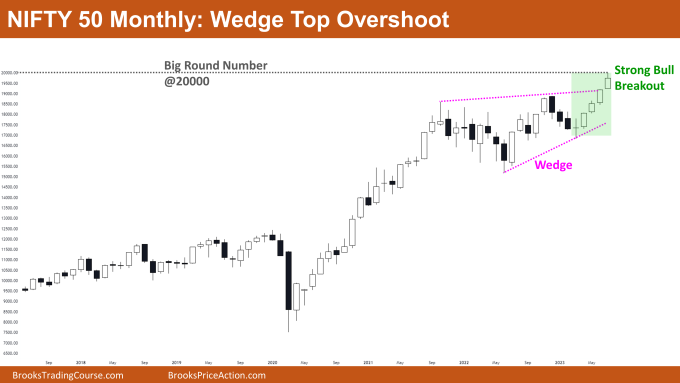
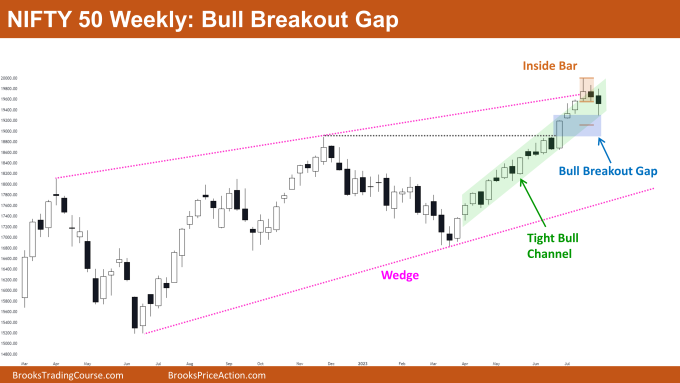
Nifty 50 Wedge Top Overshoot on the monthly chart. After the bull breakout of the wedge top, the market gave a weak bull close on the monthly chart. Bulls need good follow-through bars to successfully break out of the wedge top. Bulls need to provide a strong bull close above @20000 level in order for the market to successfully breakout of this strong resistance (the big round number 20000) on the monthly chart. Market gave a weak bearish close with a long tail at the bottom on the weekly chart, which is bad news for bears. Reversal is currently not likely on the weekly chart as bears have been unable to create a strong bear bar over the past few weeks.
Nifty 50 futures
The Monthly Nifty 50 chart

- General Discussion
- Bulls shouldn’t be selling their long positions because the market is still in a strong trend and showing no signs of a reversal.
- The chances of a second leg up are higher because the market is in a strong bull leg. Bulls can enter on a high-1 buy if they missed the trend or left early.
- Bears may think about shorting the market in order to anticipate the wedge top overshoot failure pattern if bulls are unable to give a strong follow-through in the following few bars and the market instead forms strong bear bars.
- Deeper into the price action
- Look at the bull leg (green). Almost all of the bars are closing close to their highs, which makes a reversal unlikely.
- Traders need to keep a close eye on the next 3 to 5 bars. To analyse potential future moves, they should take note of the points below in particular.
- Did bulls receive strong follow-through bars?
- If not, were bears still able to build sturdy bear bars?
- Is the market forming bars with small bodies?
- Knowing the answers to the aforementioned questions will enable you to predict whether the market will move up, down, or sideways.
- Patterns
- In general, only 25% of a wedge top’s bull breakout attempts succeed, meaning that 75% of attempts will fail and result in a higher high double top pattern.
- Because the market is in a very strong bull trend, if the bull breakout fails, there are more chances of a trading range than a reversal.
The Weekly Nifty 50 chart

- General Discussion
- On the weekly chart, the market formed a very weak bear bar. At the moment, the market is trading at the bottom of the tight bull channel.
- Bears should not be selling the market. Given that the bear bar is a high-1 signal bar, bulls can enter on its high.
- Bulls in a bull position shouldn’t leave their positions at this time.
- Deeper into price action
- The bull breakout gap is still open, so chances of a measuring gap measured move will rise if the bulls are able to give a strong follow-through after this week’s bear bar.
- Bulls may book their profits by exiting their position at this level as the market is currently trading close to the top of the wedge.
- Due to @20000 acting as a strong resistance and the market being in a strong tight bull channel, the market may exhibit trading range price action in the upcoming weeks.
- This will likely cause confusion among bulls and bears and eventually result in trading range price action.
- Patterns
- Although the market this week gave a bear breakout of the inside bar pattern, the measured move target was not reached.
- The likelihood of the market reaching the measured move target would increase if bears were able to form another bear bar.
Market analysis reports archive
You can access all weekend reports on the Market Analysis page.


Would it be possible to post Banknifty Market view as well