Market Overview: Nifty 50 Futures
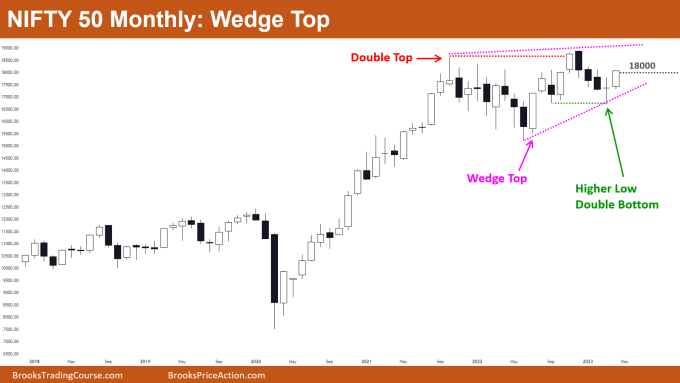
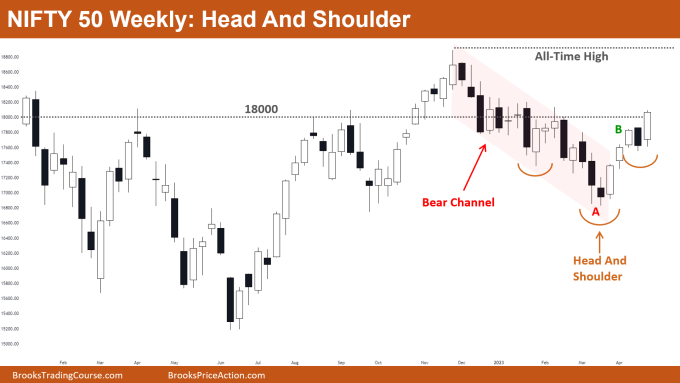
Nifty 50 wedge top on monthly chart. On the monthly chart, the market produced a powerful bull bar that closed very near to its high. The Nifty 50 was also able to close above the big round number 18000, which may be a sign of strength. Similar to the monthly chart, the market displayed a powerful bull bar that closed near its high on the weekly chart. The market is additionally forming a head and shoulder pattern.
Nifty 50 futures
The Monthly Nifty 50 chart

- General Discussion
- The bears who were waiting to short for the second leg down after the three consecutive bear bars should wait since the bull bar is really strong.
- The bull bar is powerful and the market is producing a higher low double bottom, which may persuade some bulls to buy the bull bar’s high.
- Bears were unable to turn the market around since the double top received no follow-through bars following a strong bear leg of three successive bear bars.
- Deeper into the price action
- In comparison to the bars on the left, the size of the three bear bars that followed the formation of the double top was small.
- It’s vital to remember that bears must create bear bars that are just as strong as bull bars in order for the market to reverse.
- Here’s an illustration:
- Consider that the market is in a strong bull trend.
- In order for a reversal to occur, the market must develop bear bars that are convincing enough to cause bulls to sell their holdings and bears to open new short positions.
- Patterns
- Market is currently trading inside a wedge top.
- How reversals take place: Consider the monthly chart shown above.
- Normally, the market will attempt to reverse by establishing a (very) strong bear leg initially, which will eventually result in a reversal.
- However, if bears are unable to produce a powerful bear leg like in the chart above, a double top would be their next chance to turn the market around.
- If bears are not able to get bear follow-through bars even after a double top then this disappoints the bears and gives bulls some confidence to buy which leads to a wedge top.
- Bears get their last chance to cause a reversal by selling for bear breakout of the wedge top.
- But at this point odds of a trading range are higher than a reversal.
- If bears are unable to produce a bear breakout of the wedge top then this gives bulls confidence that the bull trend would continue and pushes the prices up.
The Weekly Nifty 50 chart

- General Discussion
- Market is in a strong bull leg after the bull breakout of the bear channel.
- Bears should avoid selling the market until they see some strong consecutive bear bars again forming in the market.
- Deeper into price action
- The bull leg-B was a surprise move following the strong bear leg-A (indicated in red letters). Second legs in the same direction come after surprise moves.
- Leg-B was unexpected since traders expected the second leg to be down after the strong leg-A, but leg-B was completely the contrary of what traders anticipated.
- Bulls anticipated at least a second leg up in the market before any reversal because leg-B was a surprise move. So, in order to prepare for the second leg up, bulls place buy limit orders at the low of bull bars.
- Patterns
- A head and shoulders pattern is developing in the market. Some bulls would place their stop-loss order at the low of the right shoulder of the head and shoulders pattern and buy at the high of the most recent bull bar.
- Market has given breakout of the bear channel which means that chances of a big trading range are higher rather than a trend.
Read more about the market cycle.
Market analysis reports archive
You can access all weekend reports on the Market Analysis page.

