Market Overview: Nifty 50 Futures
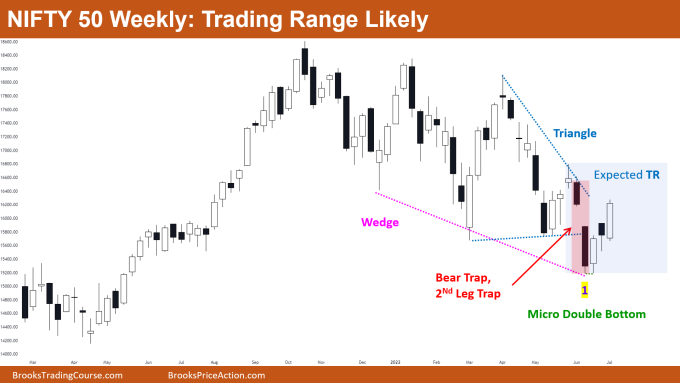
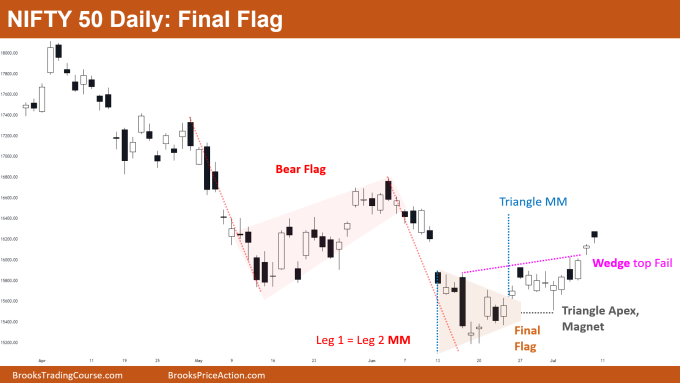
Nifty 50 futures on weekly chart gave strong bull close after wedge bottom and 2nd leg trap increasing chances of upside momentum for next week. But trading range likely due to sharp selloff in previous week. Nifty 50 on daily chart turned out that bear flag was final flag, so there may be possible reversal, or at least trading range so bear trend is less likely now.
Nifty 50 futures
The Weekly Nifty 50 chart

- General Discussion
- After bad bear close last week, there were very few bears willing to sell below bar which resulted in this week’s bull bar closing near high.
- Increasing trading range price action seen in terms of big up & big down thus trading range likely on weekly chart.
- Bears who shorted above assuming bear trend resumption with scaling in higher, so expect one more leg down before the start of bull trend.
- Deeper into the price action
- Some trading range price action traits are:
- Strong bear bars are bought and strong bull bars are sold,
- increasing tails up and down,
- bull bar followed by bear bar, and bear bar followed by bull bar,
- strong candles of either side (bull and bear candles).
- Due to increasing trading range traits, trading range more likely than bull trend.
- Bears who sold high of bar 1 would be looking to sell on the next bear bar, so you can also sell on the next bear bar expecting a small bear leg down.
- If market fails to give test of bar 1 high, then there may be possible measuring gap up, that is when you may plan for bull trend and trade accordingly.
- Some trading range price action traits are:
- Patterns
- Bears trapped selling triangle bear breakout which was also bear 2nd leg trap.
- Remember usually 2nd leg trap does not lead to trend, rather they lead to trading range. In above case, bear 2nd leg trap has less chances of leading to bull trend and higher chances that top of 2nd leg trap would be trading range top.
- Pro Tip
- Do you find yourself always taking reversal trades when day trading?
- Well, if that is the case then first of all you have to expect only 10% of the days are trending. So, missing big trends is not so bad!
- If you find that you like to trade reversal trades, and that is what your personality prefers, you can definitely make money on 90% of the days where market is not trending and moving sideways.
- ALERT! You can be profitable trading this way (ie, trading reversals) only if you are not taking reversals on trending days, right? So how can you avoid being on the wrong side on trending days?
- So here are some traits markets generally shows when we should be expecting trending day:
- Expect trends when breakout gaps remain open (on the open of market) as these lead to measuring gaps which in turn means trend.
- Expect trends when consecutive Wedges fail, for example if market formed 2 wedge bottoms but both failed, then this would mean that this can be a trending day.
- And thus, you can enter on the next breakout, or on any strong candle which is with the trend, or can enter on High 1 or High 2 flags with your stop above or below a major swing.
The Daily Nifty 50 chart

- General Discussion
- Bear flag as expected turned into final flag, trapping many bears, and market reversed up from Leg 1 = Leg 2 measured move target.
- Increasing bull closes in past several days is good sign for the bulls, but rather then leading to bull trend, we have high probability of trading range.
- Triangle apex works as magnet and that is where many bulls bought as High 2 and would be waiting for triangle measured move.
- Deeper into price action
- Apex of triangle is the level of agreement between bulls and bears which tells us that “this is the fair price”. So whenever price goes away from apex level, bears & bulls consider this overpriced and thus they sell, just like above.
- Market gapping up but not getting big and strong bull bar, which is not good for the bulls and thus increases chances of trading range.
- As trading range is more likely, traders should assume current level being trading range top and should not look to buy this high.
- Patterns
- Daily chart is in stairs pattern for a long time which means that breakout levels are tested.
- Leg 1 = Leg 2 measured move works as support.
- Final flag so possible measured move up.
- Wedge top fail so 50-50 chance market going up or down in next few days.
- 2nd leg traps are common in trading ranges so market can show strong move up in next few days. But avoid buying in panic and rather prefer buying on pullbacks only (but not too high).
Market analysis reports archive
You can access all weekend reports on the Market Analysis page.

