Market Overview: Nifty 50 Futures
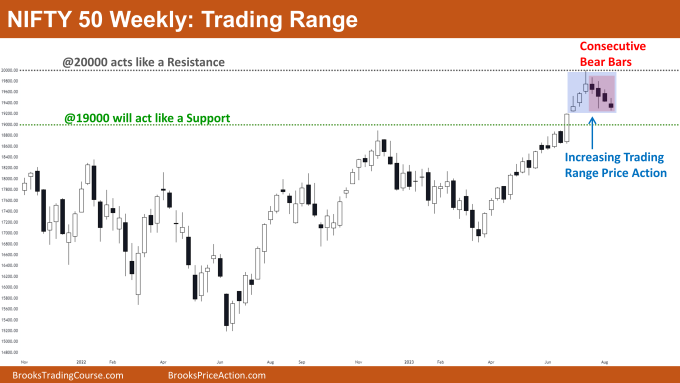
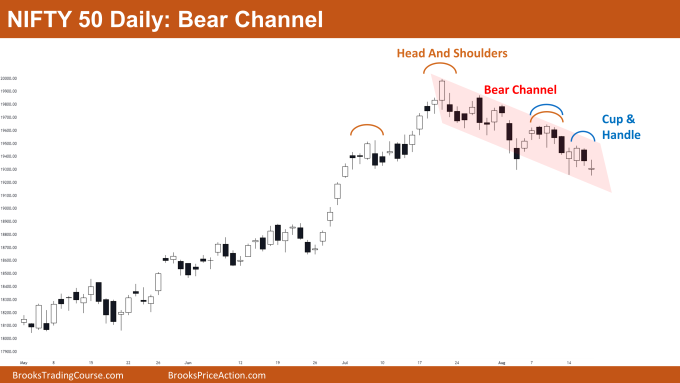
Nifty 50 Trading Range on the weekly chart. The market is fluctuating between the big round numbers 19000 and 20000 on the weekly chart, which serve as a support and a resistance, respectively. On the weekly chart, the Nifty 50 is exhibiting increasing trading range behaviour, increasing the likelihood that a trading range (between big round numbers) will exist in the coming weeks. The market is forming a cup and handle pattern as well as a bear channel as the Nifty 50 trades inside of it on the daily chart.
Nifty 50 futures
The Weekly Nifty 50 chart

- General Discussion
- Because the market is still in a strong bull trend and bears haven’t yet formed strong consecutive bear bars to reverse the trend, they shouldn’t sell.
- Bulls can aim for the large round number 20000 by buying high-1 or high-2 entries.
- Bears have been able to produce four consecutive bear bars, but because bear bars have smaller bodies and tails, it is less likely that the trend is going to reverse.
- Deeper into the price action
- For the past eight bars, the market has displayed price action indicative of a trading range. This is because the bars have tails on either side and overlapped bodies, which increase the likelihood of a trading range.
- If they are unable to provide a strong bear close below the 19000 level, bears who shorted near the high will be exiting near the 19000 level (strong support).
- Patterns
- The market is currently trading between two significant levels, which increases the likelihood of a narrow trading range.
- Bears and bulls should buy low and sell high rather than holding for a swing if bears are unable to form a strong bear bar within the next few bars.
The Daily Nifty 50 chart

- General Discussion
- Both bulls and bears should wait for a breakout attempt before entering into a new position as the market is forming a breakout mode pattern with a 50/50 chance of success.
- If bears are able to give a strong bear breakout, bears can short for the head and shoulders measured move down.
- Bulls may buy the market in anticipation of the failed breakout attempt, which could result in a trading range, if bears are unable to get a strong follow-through.
- Deeper into price action
- Since the last 20 bars, the market has formed numerous overlapping bars and bars with small bodies, increasing the likelihood of a trading range.
- According to market cycle theory, the market may enter into a trading range phase if bulls are able to successfully break out of the bear channel.
- The bull trend will come to an end and a bear trend will begin if bears are able to give a strong bear breakout with strong follow-through bars.
- Patterns
- Because the market is trading within a bear channel, there are only 25% chances that a bear breakout (overshoot) will be successful.
- Bears should therefore wait for a strong follow-through bar before taking any short positions for higher probability.
Market analysis reports archive
You can access all weekend reports on the Market Analysis page.

