Market Overview: Nifty 50 Futures
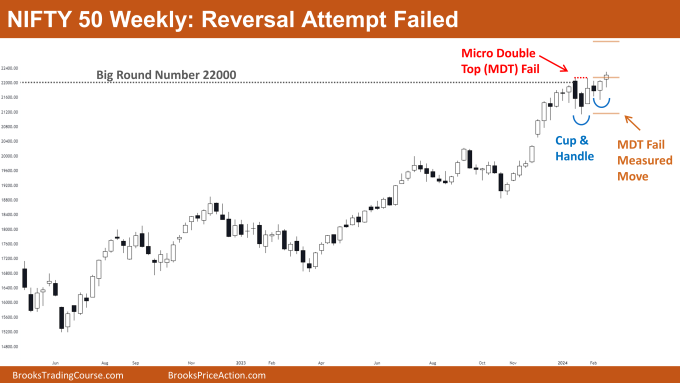
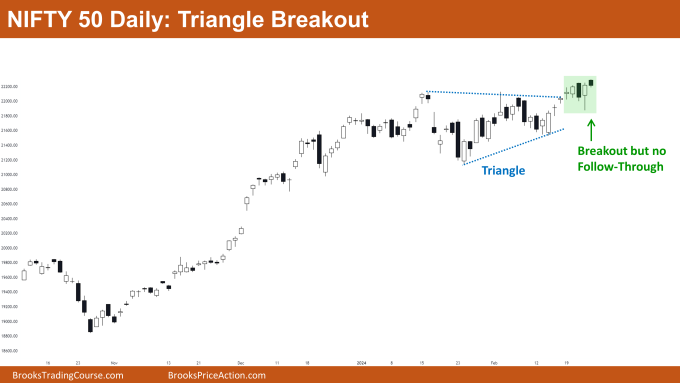
Nifty 50 Reversal Attempt Failed on the weekly chart. In this week’s market analysis, we observe a small bullish bar formation with a tail at the bottom. Despite attempts by bears to initiate a strong reversal, the bullish trend remains robust, resulting in a failed reversal. Notably, the Nifty 50 has achieved a bullish close above the significant milestone of 22,000, likely attracting more bullish activity at this level. Additionally, the daily chart of the Nifty 50 indicates a bullish breakout from a triangle pattern this week. However, post-breakout, the absence of strong follow-through bars suggests caution among bulls.
Nifty 50 futures
The Weekly Nifty 50 chart

- General Discussion
- Bulls can confidently enter long positions at the current level, given the successful close above the 22,000 mark and the failure of the micro double top pattern to trigger a reversal.
- Existing bullish positions should be maintained until the market reaches the measured move target, indicating continued bullish sentiment.
- Given the strength of the bull trend and the absence of reversal signals, bears should refrain from initiating short positions.
- Deeper into Price Action
- The failure of bears to produce a follow-through bar after the formation of the micro double top highlights their weakness, further bolstering bullish sentiment.
- This lack of bearish momentum serves to reinforce the bullish bias in the market.
- Patterns
- The failure of the micro double top pattern resembles a cup and handle pattern, implying a potential upward measured move based on the cup’s height.
- While the Nifty 50 has achieved a bullish close above 22,000, the success of this breakout hinges on the ability of bulls to generate a strong follow-through bar.
The Daily Nifty 50 chart

- General Discussion
- On the daily chart, the Nifty 50 is currently attempting to break out of its existing trading range phase.
- Bulls may consider entering positions upon observing a strong bullish close or at the market open, given the bullish breakout from the triangle pattern.
- Some bulls may opt to await confirmation through a strong follow-through bar before committing to positions.
- Conversely, bears may seek to sell if the market forms a strong bearish bar, targeting the bottom of the triangle pattern.
- Deeper into Price Action
- The market’s proximity to a significant round number initially suggested trading range price action.
- However, the breakout above this level indicates a higher probability of trend resumption.
- Patterns
- The Nifty 50 appears to be following a market cycle, transitioning through breakout, channel, and trading range phases in succession.
- Traders should consider entering breakout positions if bulls manage to produce a strong follow-through bar, targeting the measured move based on the triangle pattern’s height.
- In the absence of strong follow-through by bulls and the emergence of strong bearish bars, the market is likely to remain within the trading range, necessitating a buy low, sell high strategy.
Market analysis reports archive
You can access all weekend reports on the Market Analysis page.

