Market Overview: Nifty 50 Futures
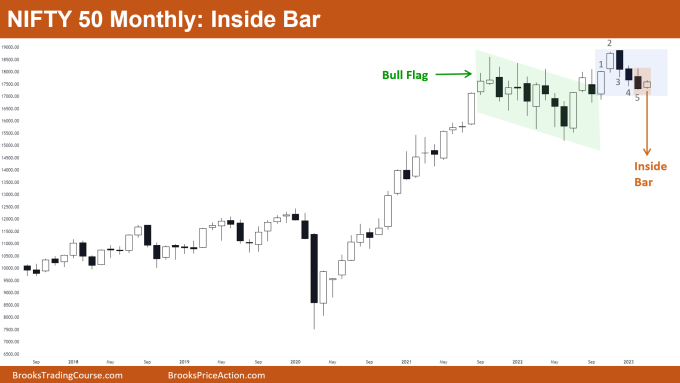
Nifty 50 inside bar on monthly chart. The market on the monthly chart created a small bull bar that closed near its high; since the low and high of this bar are both within the range of the previous bar, it is an inside bar. As the bull leg that ended on bar 2 was strong, some bulls might be looking ahead for the potential bull leg.
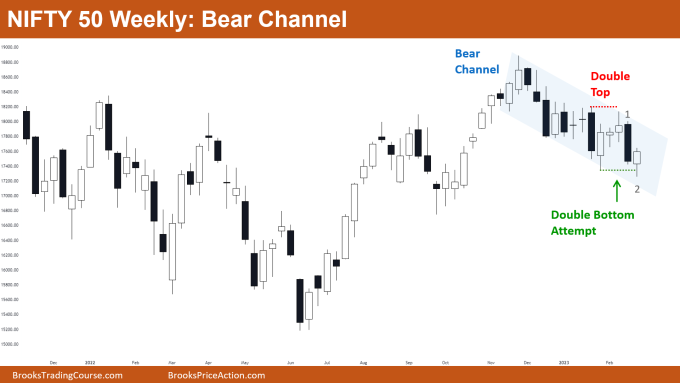
Market on the weekly chart formed a strong bull bar near the previous swing low (i.e., a double bottom attempt).
The Monthly Nifty 50 chart

Nifty 50 futures
- General Discussion
- Because of the strength of the bear leg (bar 3 through bar 5), some bears may try to sell for a second leg down scalp on Low 1.
- Because the inside bar closed close to its high and the breakout of the bull flag occurred with strong bull bars, some bulls may choose to buy at or above that level.
- Legs from bars 1 to 2 and from bars 3 to 5 had sudden up-and-down movements; this is a sign of trading range price action and could result in a tight trading range.
- Deeper into the price action
- Some bulls would scale up their position above this inside bar and would look to exit at breakeven, because bulls who bought the close of bar 2 are still unable to exit their losing positions at breakeven.
- Bull flags that occur late in bull trends frequently result in trading ranges; therefore, the likelihood of a trading range increases if bulls are unable to resume the trend within the following 5–10 bars.
- Patterns
- The current market cycle of the monthly chart is Bull Trend → Channel → Channel Breakout.
- If bears are successful in stopping the breakout, the market is likely to move into a trading range.
The Weekly Nifty 50 chart

- General Discussion
- The market is currently attempting to form a double bottom and is trading inside of a bear channel.
- Because the market is trading close to the bottom of the bear channel and the probability of a bull breakout is higher, more bulls may choose to buy around this level.
- In addition to the previously mentioned points, the market produced a strong follow-through bar following the bear bar (bar 1). This may have discouraged bears from selling near this level.
- Deeper into price action
- Many bears would have shorted at the low of bar 1 due to the double top pattern. The weak follow-through bar would disappoint those bears.
- Bears who shorted below bar 1 have several options for managing their trade:
- Some bears would trail their stop-loss to the high of bar 2.
- Aggressive bears would scale in their position at the high of bar 2 and then exit at breakeven (if needed).
- Some bears would start deciding their next action to take after the next bar closed.
- Patterns
- Pay attention out for the market to form consecutive double tops and bottoms; this is a sign of a trading range.
- Traders manage their trades more like a trading range than a double bottom when the market forms a double bottom following a double top.
- In other words, they exit near the high of the double top rather than swinging their position for the measured move up for the double bottom (because consecutive double top and bottom is just a trading range).
Market analysis reports archive
You can access all weekend reports on the Market Analysis page.


Hi, I really don’t understand how your analysis comes up with “a small bull inside bar closing on its high” as this bull inside bar has not closed yet as it is the march bar. February Bar closed on its low. Do you really start your analysis with a 2 day start into the month? What am I missing?
Thank you for taking the time to read and comment on my blog post. You are absolutely right, I apologize for my mistake in referring to the March bar as a small bull inside bar. That was an oversight on my part, and I appreciate you bringing it to my attention.
To clarify, I mistakenly referred to the March bar before it had closed, and I apologize for any confusion that may have caused.
Thank you again for your feedback, and I will make sure to be more careful and accurate in my future posts.
Hi, thank you for your answer. And I thought, I had missed something… 😉
I really apreciate your blog posts. I don’t trade nifty but what you write about patterns and “deeper into price action” helps a lot.
Your “pro tip” often has been a “golden nugget” for me!
Thanks a lot and I wish you the best!
Sir great view.!! The chart depicts more than 15 bars on the range-bound market. (What ALB call infinite pullback) Hence it’s now in the trading range. If you accompany by 20EMA you will observe that market took 20EMA support and tested the previous high. It’s more or less like the MTR setup or to be more specific it’s HH MTR setup, 40% chance you will get swing down or a 60% chance of getting sideways movement.