Market Overview: Nifty 50 Futures
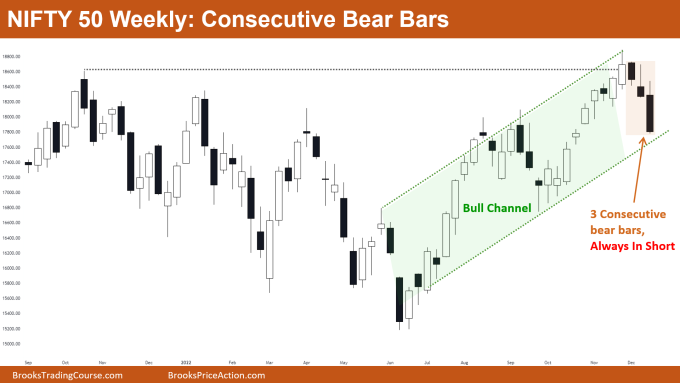
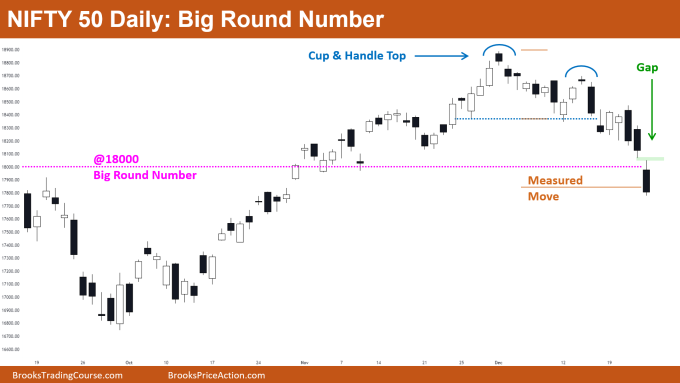
Three Nifty 50 consecutive bear bars formed on the weekly chart, with all 3 bear bars closing near their lows, but the market is still trading inside the bull channel on the weekly chart. On the daily chart, Nifty 50 has reached the measured move down of the cup and handle top, and now the market is trading near the 18,000 big round number.
Nifty 50 futures
The Weekly Nifty 50 chart

- General Discussion
- The market is currently trading inside a strong bull channel but now the market formed 3 consecutive bear bars on the weekly chart.
- The market formed a big and strong bear bar closing near the low which would create confusion among traders.
- That is because the bulls expect the market to go up (as they believe that the market is in the strong bull channel) and bears expect 2nd leg down (as the reversal attempt is strong and has 3 consecutive bear bars closing near their lows).
- Deeper into the price action
- The market has formed 3 consecutive bear bars after several trading weeks, and this would attract some bears to short at least for 2nd leg down.
- The market is in a strong bull channel but the current bear leg (3 consecutive bear bars) may have decreased the strength of this bull channel and thus it would not attract many buyers to buy at the bottom of the channel.
- Some aggressive bulls would be buying at the bottom of this bull channel.
- Conservative bulls would wait for a bull close (preferably the next bar) and would buy at or above the high of the next bull bar.
- Patterns
- The market is forming a strong bull channel on the weekly chart but the latest bull leg in this bull channel was followed by 3 consecutive bear bars.
- 3 consecutive bear bars closing near their lows = Always In Short.
- Bear leg is strong, so some bears would expect a 2nd leg sideways down.
- Pro Tip: Practice!
- Note: This would not be a price action or how-to-trade tip.
- Every week you can analyze the weekly and daily charts by drawing patterns (annotating) on the chart.
- Compare your chart and mine to get more insight and develop your charting skills. 🙂
The Daily Nifty 50 chart

- General Discussion
- The market on the daily chart has reached the measured move level of the cup & handle top.
- Move down towards the measured move was strong so bulls should avoid buying until they see some strong bull bars closing near their highs.
- As the market has reached a big round number and also at the measured move level, these levels would act as a support.
- Deeper into price action
- The last 3 bars on the daily chart were strong (3 consecutive bear bars closing near their lows) so bears would expect 2nd leg down.
- The Big Round Number and measured move acted like a magnet due to which the market moved down quickly (without any pullback).
- The market has an open gap (green color), and the market is near support levels so there are higher chances that the market would fill the gap.
- Patterns
- The market formed a cup & handle top and also gave a measured move down which was near a big round number (@18000).
- The latest 3 candles (on the right) are 3 consecutive bear bars closing near their lows therefore an always-in-short situation.
- Traders can expect 2nd leg down before any reversal occurs.
Market analysis reports archive
You can access all weekend reports on the Market Analysis page.


I know I am commenting after a long time but love your analysis. Hope you are well Rishi. Thank you for doing this most consistently.