Market Overview: Nifty 50 Futures
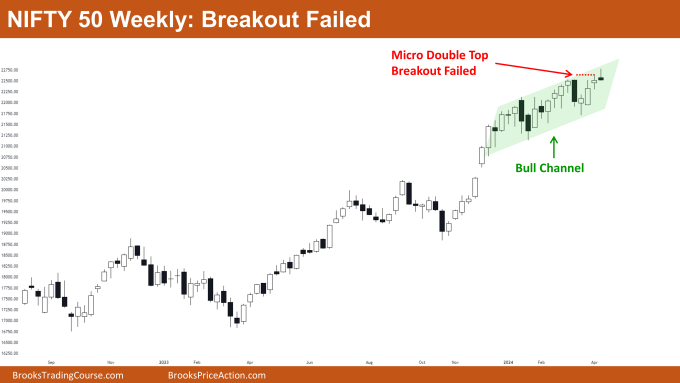
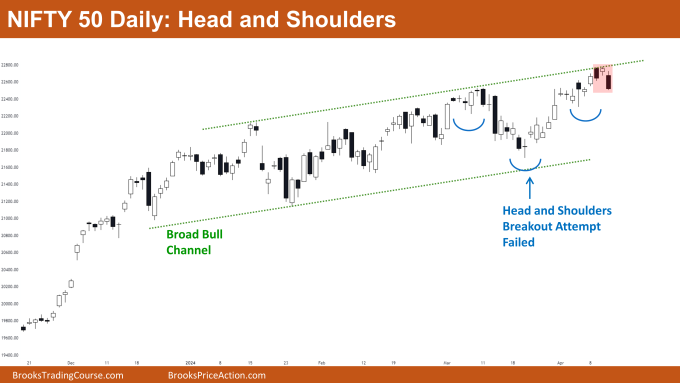
Nifty 50 Breakout Failed on the weekly chart. This week, the market showed a small bear doji bar with a short tail at the top, still trading within the bull channel. Last week, there was a micro double top formation in the market. Although the bulls managed to break above the neckline of this pattern, they couldn’t sustain the momentum, resulting in a failed breakout attempt. If bears manage to form another bear bar, traders might anticipate the beginning of a trading range. The Nifty 50 on the daily chart is currently trading near the top of the broad bull channel, having formed two bear bars that closed near their lows. Additionally, the bulls were unsuccessful in achieving a strong breakout of the head and shoulders pattern
Nifty 50 futures
The Weekly Nifty 50 chart

- General Discussion
- Bulls failed to give a strong bull breakout of the micro double top pattern and the bull channel. So, bulls should avoid taking long positions until the market forms a strong bull bar above the neckline of the micro double top.
- As the market is trading near the high of the bull channel and bulls failed to give a breakout, bears can take a scalp short position.
- Once the market reaches the bottom of the bull channel, bears should exit their trade as this would be a scalp trade and not a swing trade.
- Deeper into Price Action
- Whenever a bull trend is strong, then the chances of a major trend reversal are only around 20%. So, traders who would be taking a reversal trade for major trend reversal must maintain a risk to reward greater than 1:3.
- See the above chart, note that the bull trend is very strong and currently the bears have only formed a small doji bear bar. This doji bar is not strong enough to reverse this strong trend, so traders should avoid taking a swing short position; instead, they can take a scalp position.
- Patterns
- Market is trading in the bull channel and now bulls failed to give a bull breakout of the channel and of the micro double top.
- Now, the chances of a bear breakout have increased due to the above reasons. But, as the market is in a strong bull trend, the best bears can get for now would be a trading range and not a major trend reversal.
- If the bears are able to form strong bear consecutive bear bars only then the chances of a major trend reversal would be high.
The Daily Nifty 50 chart

- General Discussion
- Market is trading near the top of the broad bull channel, suggesting that bulls should refrain from buying until the market revisits the bottom of the bull channel.
- Bears can consider selling at this level. Additionally, bears have formed two robust bear bars closing near lows, increasing the likelihood of a bearish movement.
- Bears seeking further confirmation before initiating a short position might await a low-2 signal bar or wait for the next strong bear bar closing near the low to enter a short position.
- Deeper into Price Action
- The market has been exhibiting numerous bars with long tails and small bodies. Over the past few weeks, there have been frequent formations of double bottoms and double tops.
- This indicates that the market is currently in a trading range phase. To transition back into a trend phase, bulls or bears typically need to generate a strong breakout from a breakout mode pattern.
- Patterns
- Bulls have failed to initiate a bull breakout of the head and shoulders pattern, likely leading to the transformation of the pattern into a trading range.
- The market is operating within a broad bull channel, allowing both bulls and bears to capitalize by selling high and buying low.
Market analysis reports archive
You can access all weekend reports on the Market Analysis page.


Appreciate your analysis , Love to see if you add some important support and resistance level
Thanks
Absolutely, thank you for the feedback! I’ll definitely include support and resistance levels in my next analysis.