Market Overview: Nifty 50 Futures
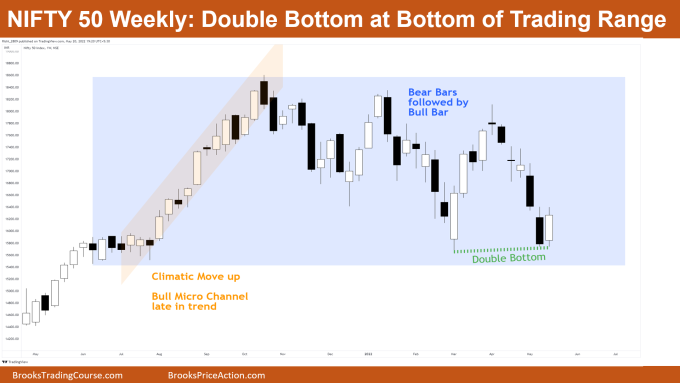
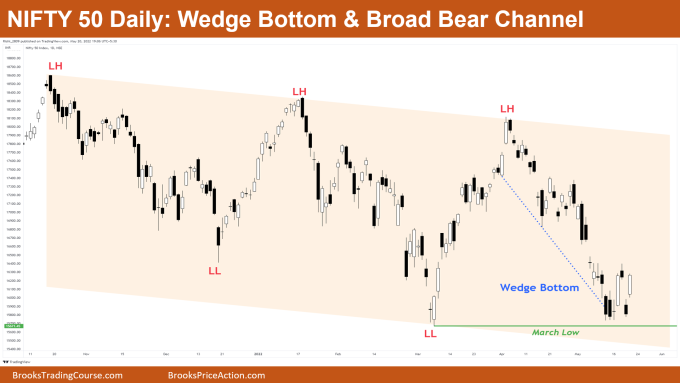
The Nifty 50 futures on the weekly chart formed a double bottom at bottom of trading range which is also the bottom of a bull micro channel. Nifty 50 on daily chart still in the broad bear channel and forming wedge bottom near March month low which is strong support.
Nifty 50 futures
The Weekly Nifty 50 chart

- General Discussion
- Market forming double bottom at the bottom of the trading range.
- Market came down with 2 consecutive bear bars with a bad follow-through bar, which was this week’s close.
- Leg 1 = Leg 2 measured move is still not hit (as discussed in the last blog)
- Deeper into the price action
- Whenever you get a bear bar followed by bull bar, this means market is not getting follow through.
- This clearly gives us clue that market is either in a trading range or in a broad channel.
- Whenever you see a bull micro channel late in bull trend this usually becomes a leg in the developing trading range.
- Patterns
- Double Bottom near bottom of range, market currently offering us High 2 entry for the double bottom.
- The High 2 signal is also an inside bar.
- Market has already tested the bottom of the bull micro channel and gone 2 legs up (which is the least we expect).
- Now chances are that market can trap some bulls above this inside bar and market can reverse for a leg 1 = leg 2 measured move down.
- The above possibility is only if next week’s market gives a bad follow through to this bull inside bar.
- Pro Tip
- Whenever you see climatic move upside, without much of pullback late in trend, this means market has not high probability of converting at least into trading range.
- Probability of trading range increases when you see bear bar followed by bull bar, i.e., bad follow through for each bar.
- Increasing number of tails is also a sign that market would soon convert into a trading range (can you see increasing tails in above chart?).
The Daily Nifty 50 chart

- General Discussion
- Market still above the March month low and reversed above with bull bar closing near high.
- Overall market in broad bear channel with climatic moves up and down.
- This is the 2nd leg up after market formed a wedge bottom.
- Deeper into price action
- Note that whenever you see market making lower lows and lower highs and also showing you climatic moves up and down, this would simply mean that market is in broad bear channel.
- Market generally traps bulls on 2nd leg up in the bear channel, the legs seem to be always in long but it’s often a trap. (Also called 2nd leg trap)
- The last leg down in the broad bear channel was very strong, and if you look carefully, the market gave us trading range price action near the bottom of the channel. (See the move up and down near the bottom of the broad bear channel.)
- Patterns
- Market forming wedge bottom near the channel bottom, and already started with the 2nd leg upside.
- The move down in the wedge bottom is quite steep, due to which traders look to short on 2nd leg trap of this wedge bottom.
- Any time you see market making consecutive bear bars, after the 2nd leg up, this can indicate that the bulls failed to drive the market higher.
- As bears know this, they would sell the market.
Market analysis reports archive
You can access all weekend reports on the Market Analysis page.


Great insights Rishi.
Hey, thanks Tanmay
Rishi, great analysis of Nifty! What are your thoughts on correlation between S&P and Nifty price action? If the S&P is in pullback after 20% correction, would that mean lower lows for Nifty if S&P were to head lower. Nifty price action is stronger with only 15.7% correction so far.
Thanks for that comment Chetan,
I really don’t look at correlations between different charts, and I prefer trading the chart in front of me based on price action rather then seeing correlation.
These are just my beliefs, if correlations make sense to you, then just go for it!
Thank you