Market Overview: Nifty 50 Futures
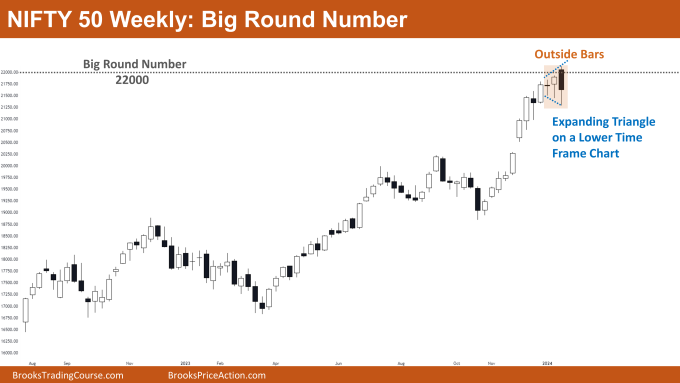
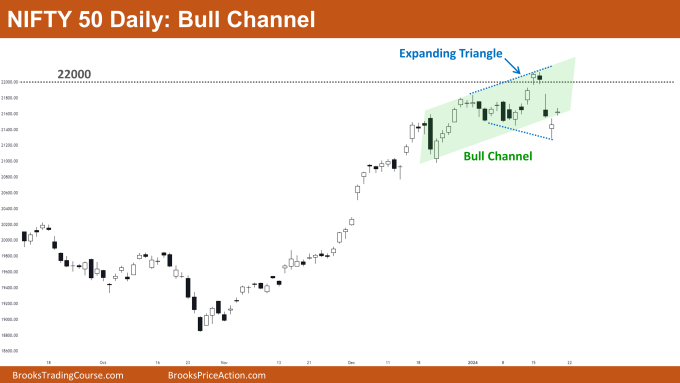
Nifty 50 Big Round Number on the weekly chart. On the weekly chart, a notable event unfolded as the market formed another outside bar pattern, hinting at a potential increase in trading range price action. Despite a weak bear close this week, it is insufficient to reverse the prevailing strong bull trend. On the daily chart, Nifty 50 encountered a bear breakout of the bull channel, only to swiftly resume trading within the channel due to the absence of bear follow-through bars. An uptick in the frequency of bear bars on the daily chart raises the possibility of the market transitioning into a trading range.
Nifty 50 futures
The Weekly Nifty 50 chart

- General Discussion
- The market continues to operate within a robust bull trend, evident by the absence of consecutive bear bars. Since the latest bear bar lacks the strength to reverse the bull trend, bears are advised to hold off from selling.
- Bulls already in a long position should maintain their positions, as there are no indications of a reversal.
- For those seeking to enter this bullish trend, an entry at the high of the outside bar or waiting for a high-1 or high-2 entry bar is recommended.
- Deeper into the Price Action
- Proximity to the significant big round number 22000 increases the likelihood of trading range price action in the coming weeks.
- Notably, Nifty 50 has started forming bars with small bodies and long tails, signaling a potential increase in trading range price action.
- Patterns
- The presence of consecutive outside bars near a significant level, such as 22000 in this case, serves as a clear sign of trading range.
- An outside bar on a higher time frame corresponds to an expanding triangle on a lower time frame.
The Daily Nifty 50 chart

- General Discussion
- Operating within a bull channel, both bears and bulls have opportunities to profit by selling near the top and buying near the bottom of the channel.
- Bulls holding long positions are encouraged to maintain their positions until a strong bear breakout of the bull channel occurs.
- Prospective bulls looking to enter a long position should wait for the market to form strong bull bars or a robust bull breakout above the big round number 22000.
- Deeper into Price Action
- Notably, the market is witnessing the formation of large bear gaps on the daily chart after a prolonged absence.
- An increase in the frequency of bear bars, coupled with the market transitioning from a tight bull channel (stronger) to a bull channel (weaker), signals a clear shift towards trading range price action.
- The occurrence of bad follow-through bars, where bear bars are followed by bull bars and vice versa, strongly indicates the prevalence of trading range price action.
- Patterns
- The market adheres to the market cycle theory, progressing through phases in a specific order: breakout phase, tight channel phase, broad channel phase, trading range phase, and then repeating the cycle. Currently, the market is in a bull channel phase, pointing to the likelihood of trading range dynamics in the weeks to come.
Market analysis reports archive
You can access all weekend reports on the Market Analysis page.

