Market Overview: NASDAQ 100 Emini Futures
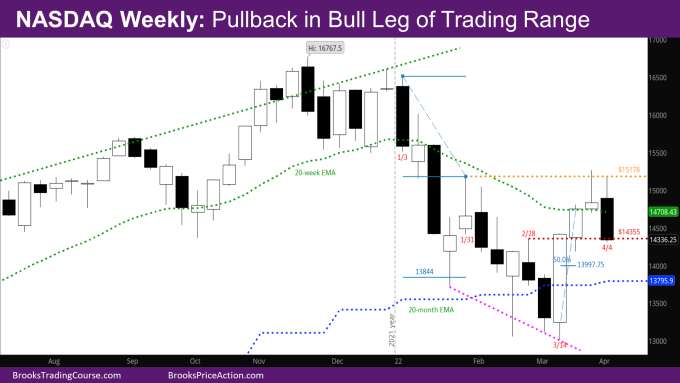
This week’s Nasdaq Emini candlestick was a bear bar closing on its low, a pullback in bull leg. It triggered last week’s Low 2 sell signal and closed below the weekly EMA.
The week started strong, attempting to retest last week’s high, but reversed down again at the swing lower high of the week of 1/31. The market also went below the high of the week of 2/28 at 14355 as mentioned in last week’s report. This is a sign that the market is in a trading range – when limit order bears are making money in a move up, it is a trading range.
It is likely the next few weeks will be sideways to lower between the weekly and monthly EMA.
NASDAQ 100 Emini futures
The Weekly NASDAQ chart

- This week’s NASDAQ candlestick was a bear bar with a close at its low. It triggered last week’s sell signal bar and went below the 20-week EMA.
- Last week’s report mentioned that the market should at least go down to the high of the week of 2/28 at 14355. That high was a reasonable Limit Order sell on the way up, and hence bears selling it should make money. The bears accomplished this. They also managed to close near the low of the week, and a bear body big enough to reverse the bull bodies of previous two weeks.
- Next week should go below this week’s low to see where the buyers come in.
- A couple other possible magnets on the lower side for the next few weeks are:
- The 1X move for a Limit sell at the 1/31 high (15178) with a stop at 1/3 high (16512) which leads to 13844 – essentially around the 20-month EMA.
- Or the 50% pullback of bodies of the breakout bar 3/14 and follow-through bar 3/21 at 13997.75, where buyers will likely come in.
- Unless the bears can have successive strong bear bars closing below the 20-month EMA, it looks like the lower end of the range will be at or above the 20-month EMA.
The Daily NASDAQ chart

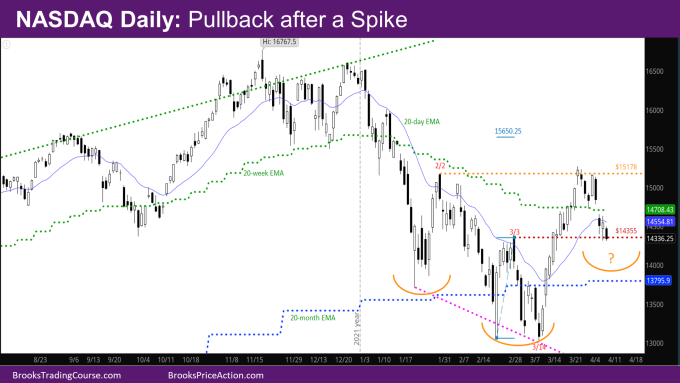
- Friday’s candlestick on the daily NASDAQ chart was a bear bar closing near its low. The daily chart is back below the 20-day EMA.
- The daily chart is pulling back from the tight bull micro channel/spike that started in the middle of March. The spike had 6 days where the low was above the prior low, and strong trend bars on 7 of the 11 days of the up move.
- The pullback so far has had two legs. The second leg this week is tight – the high of every day lower than the previous day. Friday also closed on its low. Both these reasons make another leg down likely.
- At the same time, it’s not as bearish as it could be – Monday was a strong bull day, tail below bars on Wednesday, and a bull bar on Thursday. Thus, the pullback will likely be a wedge bull flag down to some of the targets mentioned in the Weekly analysis above.
- The market has tested the breakout point of 3/3 high (at 14355 mentioned on Weekly chart) and closed near it on Friday.
- There should be a 2nd leg up for the spike after the pullback ends. One of the upside targets could be a measured move up from 3/3 and the low of February/March to approximately 15650, assuming the pullback does not go much lower than 3/3 high. Another possibility is a Leg1/Leg2 move.
- The market may also try to make the right shoulder of an inverse head & shoulders with neckline at 15178.
Market analysis reports archive
You can access all weekend reports on the Market Analysis page.


Thank you!