Market Overview: NASDAQ 100 Emini Futures
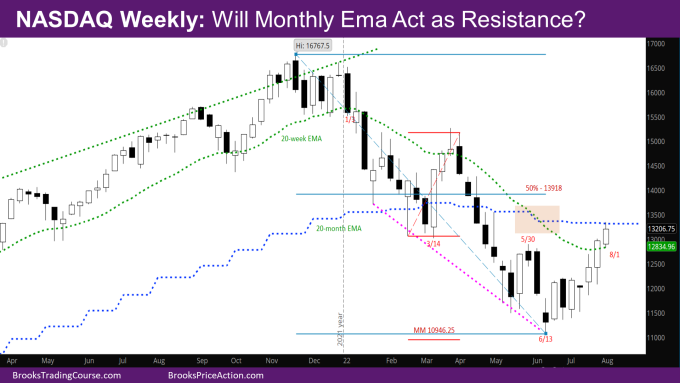
The NASDAQ Emini futures market has had consecutive bull trend bar closes above the weekly exponential moving average (EMA) for the first time this year. Bulls reached target of monthly EMA which may now act as resistance.
Every day this week was a bull day, although with enough trading range price action – tails above bars. The market poked above the monthly EMA and retreated, causing a small tail above this week’s bull bar.
NASDAQ 100 Emini futures
The Weekly NASDAQ chart

- This week’s Nasdaq Emini candlestick is bull trend bar with a small tail at the top.
- While the bulls have done a lot, this week’s bar is small compared to last week, and the market is butting right against the monthly EMA again.
- What would have been ideal for the bulls, is to have a bar proportional to last week, which would have made the bar close far above the EMA. (e.g., the week of 4/13/2020)
- Positives for the bulls so far:
- Consecutive bull close above EMA with good bull bars for the first time in 2022.
- Consecutive bull close above the last swing high of 5/30.
- Seven-week bull micro channel – the low of last seven weeks above prior week low. Technically, three of them were sideways weeks.
- Bulls made the target of the monthly EMA. Next target for bulls is the high of May at 13555.25.
- So, how does this reversal compare to March –
- Good:
- The bars this time are more proportional to each other compared to March when one bull bar was extremely big. The next was smaller and closed right at the EMA, and the third bull bar closed above EMA, but had a big tail at the top.
- Seven-week micro channel this time as mentioned earlier.
- Bad:
- The monthly EMA was support at that time, and the market reversed from the monthly EMA. Now, the market has been under the monthly EMA for the last 3 months, and monthly EMA will likely be resistance.
- The bulls still have the bear signal bar from 6/16, which may require a re-test.
- Next week is important in deciding the character of the market – if it’s a bull trend bar closing near its high, bulls will likely keep buying.
- If the bears create a bear bar, they can start a pullback for a week or two, which is very likely in the next few weeks.
- As it stands, another leg up is very likely after a pullback.
- The bears may aim for a wedge bear flag somewhere around the 50% retracement of the move down since the all-time-high at 13918.
The Daily NASDAQ chart

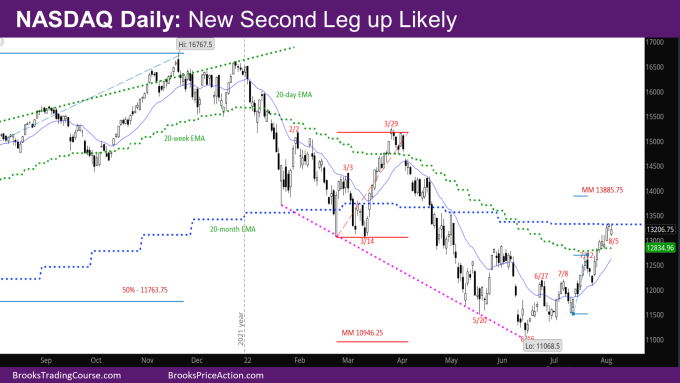
- Friday’s NQ candlestick is a bull bar with a tail at the top. Apart from Wednesday, every other day had tails indicating trading range price action.
- Monday, Tuesday, and Friday gapped down, yet closed with bull bodies. This shows that bulls are buying aggressively, and bear attempts to reverse are failing.
- Since we are now at the monthly EMA, it will be interesting to see if bulls take profits. If they do, bears will sell to try and reverse the market, or scalp to back below the weekly EMA.
- The market has crossed sufficiently above the MM target of 12910.75 shown in the last daily report.
- The market tried making a double top with the 5/30 swing high on 7/22, but that has failed. So, the next MM target could be using that double top at 13885.75, which is also around the 50% retracement of the entire move down. (There are several ways to draw the MM target. This is one of them)
Market analysis reports archive
You can access all weekend reports on the Market Analysis page.

