Market Overview: NASDAQ 100 Emini Futures
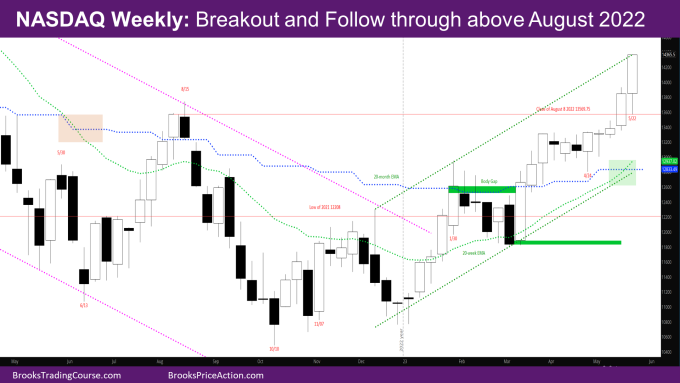
The NASDAQ Emini futures week is a bull trend bar closing on its high far above last week’s high and the August 2022 high – a Nasdaq breakout and follow through. The tail at the bottom of the week tested the breakout point above August 2022.
By having a strong follow-through bar, bulls have answered the question whether last week was a climax bar or not.
So far, the monthly bar is a big bull trend bar. At this point, the month should close above the August 2022 high. This would be the first time the market has closed above a major swing high.
NASDAQ 100 Emini futures
The Weekly NASDAQ chart

- This week is a big bull trend bar closing on its high far above the prior week high.
- At this point, the market will likely go up for 2 more legs.
- The next bull target is the close of 3/28/2022 at 14831.
- The market is at the high of a channel as shown on the chart.
- As a result, there should be a pullback in the next few weeks.
- If bulls can keep the gap open with August high, the possible measured move target of the August 2022 to December 2022 low would put the market back near the all-time high.
- As mentioned last week, bears have not done much yet.
- There have been no consecutive bear bars since December of 2022.
- There has not been a close below a prior bar since early March.
- The first bear target is to close the gap with the August high.
- There is also a body gap created by the week of 1/30 – There has not been a bear close after the market broke above the close of 1/30 that overlaps with the body of 1/30.
- The next target for bears will be to close the body gap by going below close of 1/30 – 12613.25
- The weekly exponential moving average (EMA) has just crossed over the monthly EMA for the first time since it crossed below in June 2022 (shown by the green shaded region on the chart)
The Daily NASDAQ chart

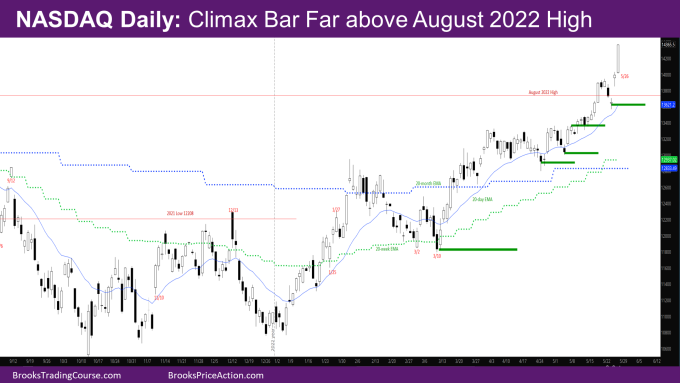
- Friday is a huge bull climax bar.
- As mentioned last week, the market was going up parabolically last week and was not sustainable.
- The market had a strong pullback on Tuesday and Wednesday.
- Thursday gapped up above last week’s high, and was a surprise.
- Friday’s price action may have been from all the trapped bears giving up.
- At the same time, the sell-off Tuesday and Wednesday could have to been to relieve trapped bears who may have sold the August high last week.
- Either way, the price level around Wednesday should be a magnet for a future test, and likely support.
- The challenge with big bars like Friday is that they will find profit takers.
- The first half of next week are the last trading days of the month. It is likely that the 2nd half of the week will go sideways to down.
- When there is a bigger pullback, some of the possible targets and areas of support are shown in the chart.
Market analysis reports archive
You can access all weekend reports on the Market Analysis page.

