Market Overview: NASDAQ 100 Emini Futures
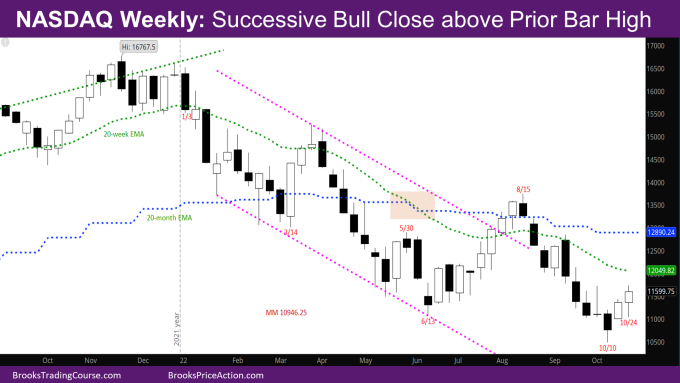
The NASDAQ Emini futures market is attempting a reversal up from the October low. It is the first successive bull close above prior week high since the last bull leg that started in July. As mentioned in the report two weeks back, the market is likely making its way to the weekly exponential moving average (EMA).
On the monthly chart, the October bar is a good-looking High 2 bull reversal bar. If Monday can close as a bull bar without being a very big day, it should lead to higher prices on the monthly chart at least to the monthly EMA.
NASDAQ 100 Emini futures
The Weekly NASDAQ chart

- This week’s candlestick is a bull bar with a tail at the top, and a longer tail at the bottom.
- Bears did sell earlier in the week at the high of week of 10/3 causing the tail at the bottom of this week.
- The market is likely making a leg up to the weekly EMA like it did back in July.
- One problem for the bulls again is that the signal bar from the week of 10/10 is a bear bar like back in June. What is good for the bulls is that they have consecutive bull bars closing above prior bar’s high.
- This is still likely a minor reversal and bulls will need a good entry bar in the next month or two around the bar from the week of 10/10.
- If next week is a bull bar, it will likely close right at or slightly above the weekly EMA as opposed to far above the EMA. The problem with this is that it will give bears a chance to sell the weekly EMA.
- Another problem for the bulls is that the weekly EMA and the monthly EMA have diverged again quite a bit compared to August when they were closer.
- This means bulls must do more work to go above both the EMAs, while giving bears a chance to scale in at the monthly EMA.
The Daily NASDAQ chart

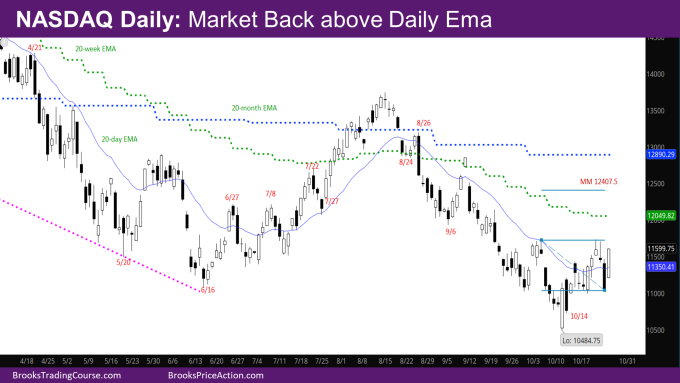
- Friday’s NQ candlestick is a big bull trend bar closing above the daily EMA.
- The market was up Monday and Tuesday reaching the level of the high of 10/3 and sold off there on Wednesday and Thursday. Friday gapped up and recovered most of those losses.
- An inverse head and shoulder (IVH) with the neckline at 11721.5 would put the target at 12407.5 using the right shoulder.
- Using the head, the target would be around the monthly EMA. Both are realistic targets before the end of the year.
Market analysis reports archive
You can access all weekend reports on the Market Analysis page.

