Market Overview: NASDAQ 100 Emini Futures
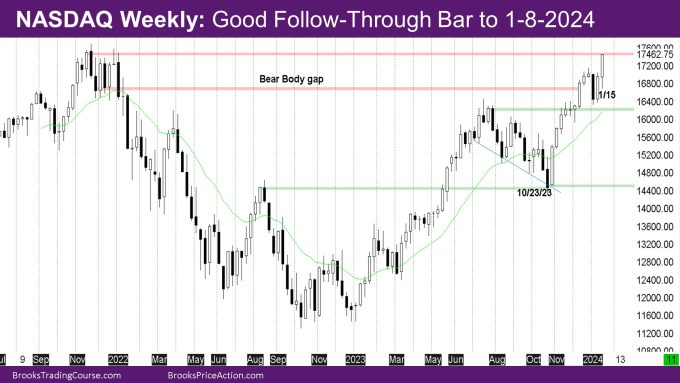
The NASDAQ Emini futures week is a big bull trend bar with a tail below. It is a good follow-through to the bull reversal bar of 1-8-2024. Given the strength of this leg, there should be another leg up.
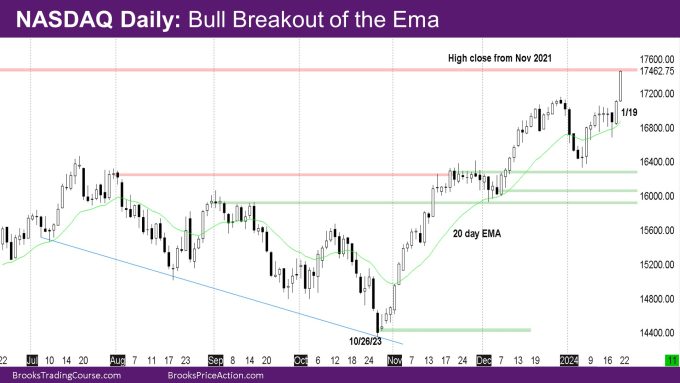
On the daily chart, the market broke out from the daily exponential moving average (EMA) with big bull bars on Thursday and Friday, to reach the daily high close from November 2021 (using the back-adjusted continuous chart).
The monthly bar is a bull bar with a close above December high, and a long tail below. There are still 1.5 weeks left. Bulls would like to close the month as a bull bar ideally with a close above the December high, thus creating a micro-channel with the October low. Bears would like to close the month as a bear bar, even if it’s a bad sell signal bar (with the long tail below).
NASDAQ 100 Emini futures
The Weekly NASDAQ chart

- The week is a bull trend bar with a tail below.
- Last week’s report had mentioned that bulls need a follow-through bull bar, as last week triggered a bad H1 buy signal bar of 1-1-2024.
- It was less likely that this week would be a good bull bar, but bulls got their follow-through bar.
- The tail below on this week’s bar is likely the 2nd leg corresponding to the big bear bar of 1-1-2024, for now.
- The market is at important resistance – the high close from November 2021, so this could also have been buy vacuum test of resistance.
- Given this bull strength, it is likely that there will at least be another leg up, possibly two if next week is another bull bar.
- If next week is a bull bar with a low above this week’s low, it will create a bull micro-channel of 3 lows higher than the prior bar low.
- If next week is a bull bar, then the market will likely come back to its close even if there is a deep pullback.
- The last monthly report had also mentioned that it is unlikely for January to be a bull bar with a low above last month’s low – creating a bull micro-channel.
- January has gone above the December high, and so far, is a bull bar. Best bears can hope is a doji bar with a bear body.
- The market is also close to the measured move (MM) target of the bodies of the May and June Monthly bars at 17602.75.
The Daily NASDAQ chart

- Friday is a big bull trend bar closing at its high and reaching the daily high close from November 2021 on the back-adjusted continuous contract chart.
- While Thursday and Friday look like buy climaxes, they are breaking out from the daily EMA and look more like the start of something than the end of something (which is what climaxes usually represent).
- At the same time, since it is at an important resistance, its also possible to have a deep pullback.
- This week was likely to have a 2nd leg down corresponding to the strong leg down in the first week of January.
- Tuesday was the first trading day as Monday was a trading holiday and ended as a doji.
- Wednesday was a bear bar that closed above the midpoint and the daily EMA.
- Thursday was a bull trend bar closing near its high above the Wednesday high, and Friday a big trend day from the open.
- So, for now, the second leg down is limited to the bear bar of Wednesday.
- It is likely the market will revisit the strong leg down in January at some time in the future, when the current move up transitions into a trading range.
Market analysis reports archive
You can access all weekend reports on the Market Analysis page.


Rajesh, thank you for your excellent work here. Which platform and/or setting do you use to access / create “…the back-adjusted continuous chart” (NQ weekly, etc.). I would truly appreciate your guidance. Thank you!
Hello Kai-Uwe, I switched to sierra chart about a month ago. Before that I was using thinkorswim which does not back-adjust weekly or monthly timeframes. Sierra chart is very flexible- it gives you the option to show continuous contracts with back-adjusting or not