Market Overview: FTSE 100 Futures
The FTSE futures market moved higher last month with bull breakout and follow through. Although this month had a tail on top, the probability is still always in long. Because of the sideways action and the lack of high-probability stop-entries, many limit-order traders will be betting on more sideways. If you had to be in, it is better to be long or flat. Most bears will expect a better sell signal before selling for a test of the breakout points and perhaps deeper into the range below.
FTSE 100 Futures
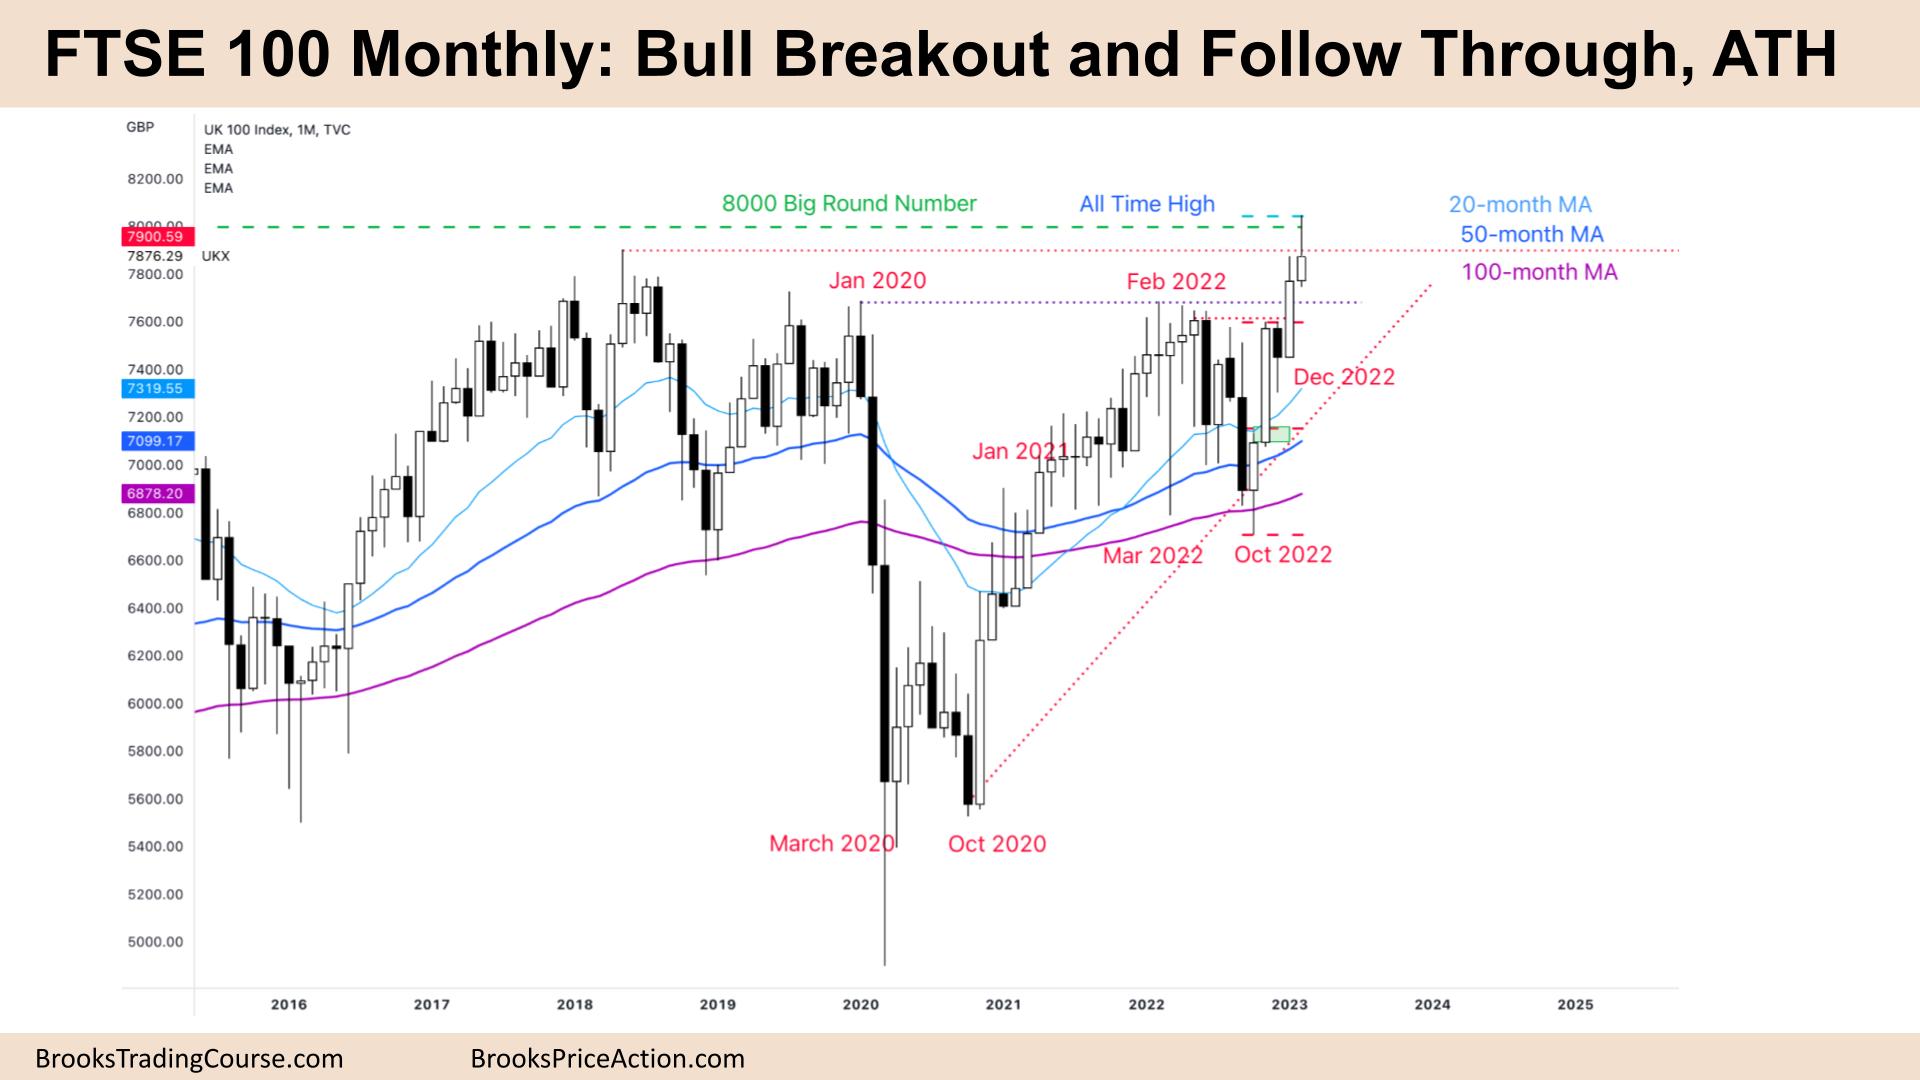
The Monthly FTSE chart

- The FTSE 100 futures was a bull bar closing below its midpoint with a big tail above.
- It’s a bull breakout and follow through at an all-time high.
- Traders see a 5-bar bull micro channel, so expect the first reversal to be minor. Bulls will likely buy the first bar to go below the low of a prior bar on the monthly chart.
- The bulls see a breakout above a trading range and want a measured move up.
- The bulls also hit a swing target and a measured move target from the November buy signal trading above October.
- The bears saw strong tails at the all-time high (ATH) and prior high of the trading range, and were always going to sell strongly there. Because January was such a strong bar, they sold February.
- The bears want a micro double top in March to sell below, even though they know the reversal will likely be minor.
- The bulls need a pullback to the breakout point and a bear bar on the monthly with a tail to have a chance at a second leg up out of the range.
- It is more likely both will be disappointed. Either a big bear bar, with a size too large for bears to sell. Or a weak bull inside bar, forcing traders to buy high.
- We are also at the 8000 Big Round Number, so we might go sideways here as traders decide where to go.
- Expect sideways to up next month – traders will be watching the micro double top or breakout above February’s tail.
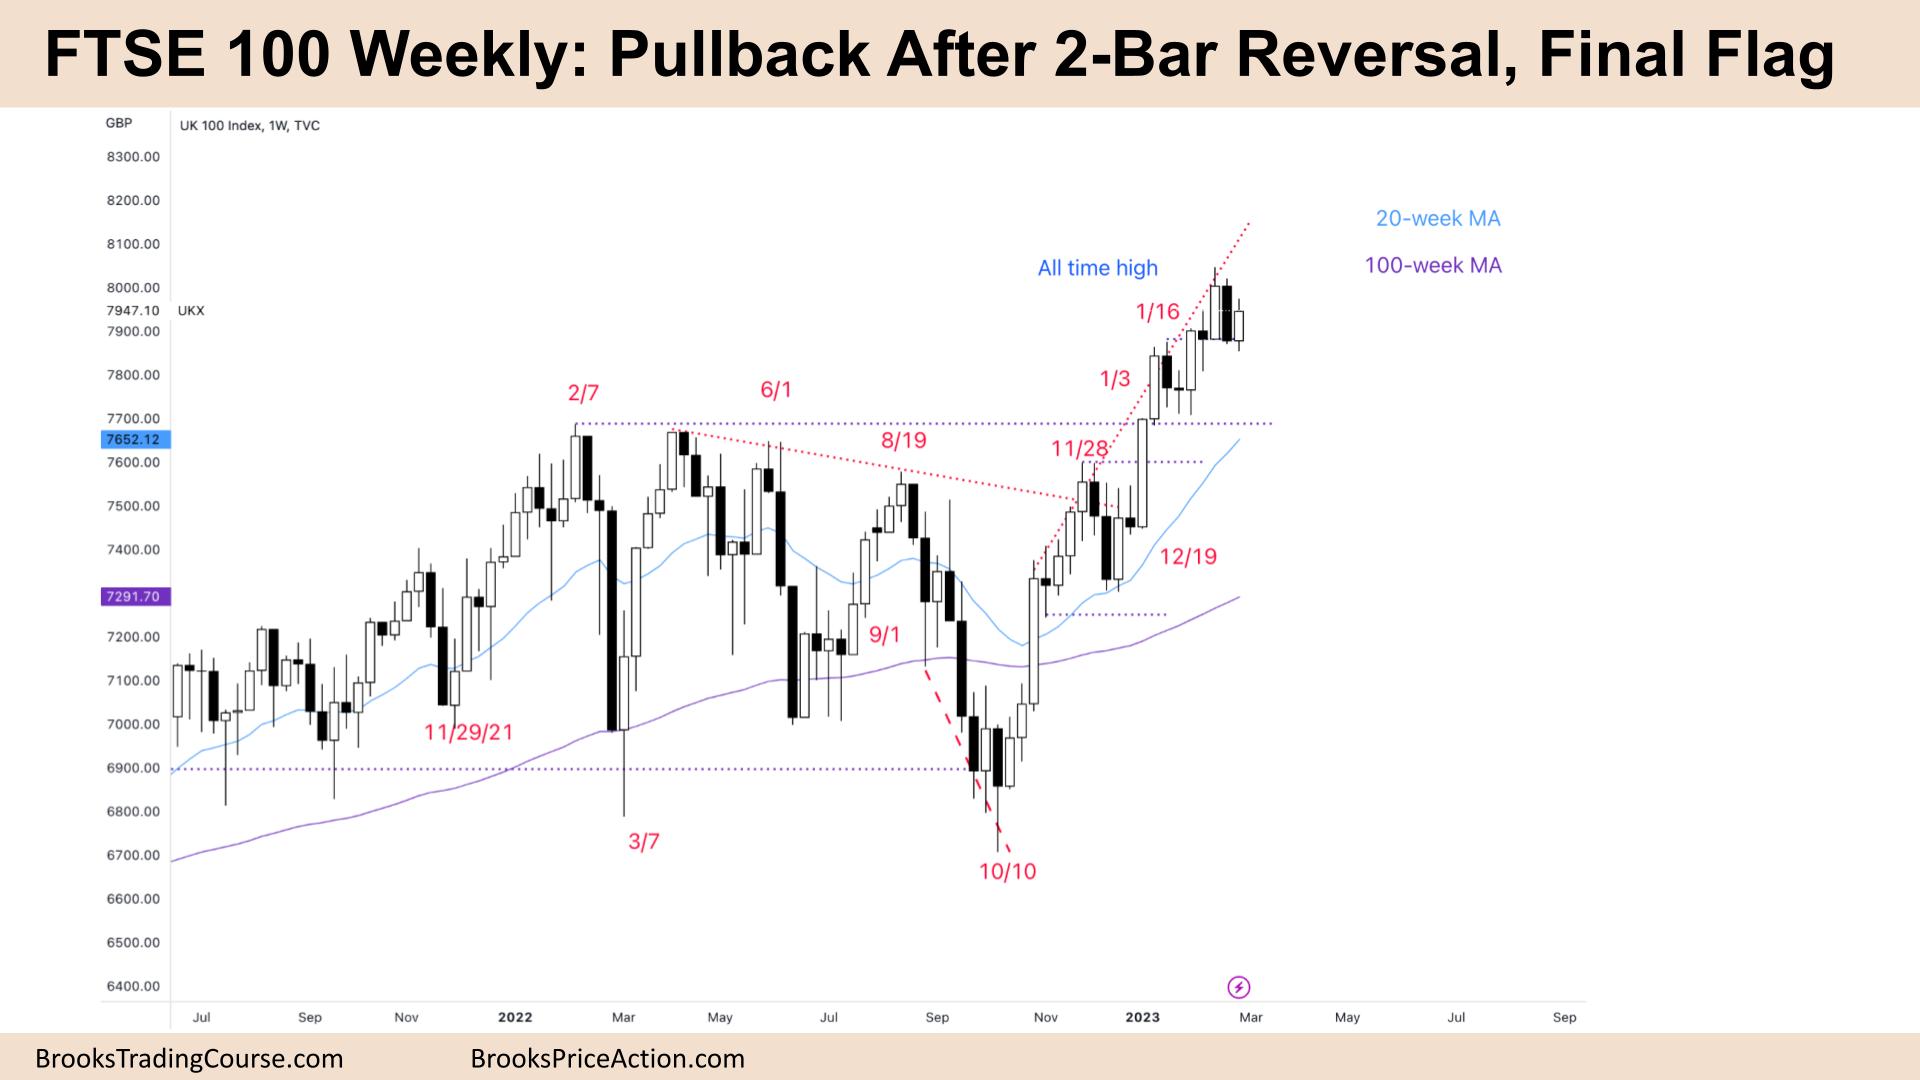
The Weekly FTSE chart

- The FTSE 100 futures was a small bull with tails above and below.
- It is a pullback after a bull breakout and 2-bar reversal for a possible final flag.
- Both traders see the tight channel, and we are always in long.
- Some bulls would have exited below last week’s bear bar closing on its low. Others will exit on a second reversal down.
- It’s a bull bar closing above its midpoint, so it is a buy signal. But it is not a high-probability trade after a big bear bar. So we are likely going to go sideways next week.
- Bulls see a complicated second leg up from the trading range lows. They see a breakout, follow-through, and stop entry bears unable to make money.
- They see limit-order bears unable to make money – the pullbacks never went below swing points. This means the trend is strong.
- Bears see a broad bull channel, a type of sloping trading range and are looking to sell second entries for a two-legged correction back to the moving average or inside the trading range before.
- Probability favours the bulls still, and we might need to form a wedge top or blow-off top buy climax before the bears get a corrective move down.
- The bears need another bear bar closing on its low to attract stop-entry bears.
- Limit-order bears will start to sell above the high of the bear bar, betting the stop for the bulls is too far away.
- Most traders should wait for consecutive bars to make it clearer for a stop entry.
- We are still on the bull breakout, so expect sideways to up next week.
Market analysis reports archive
You can access all weekend reports on the Market Analysis page.

