Market Overview: FTSE 100 Futures
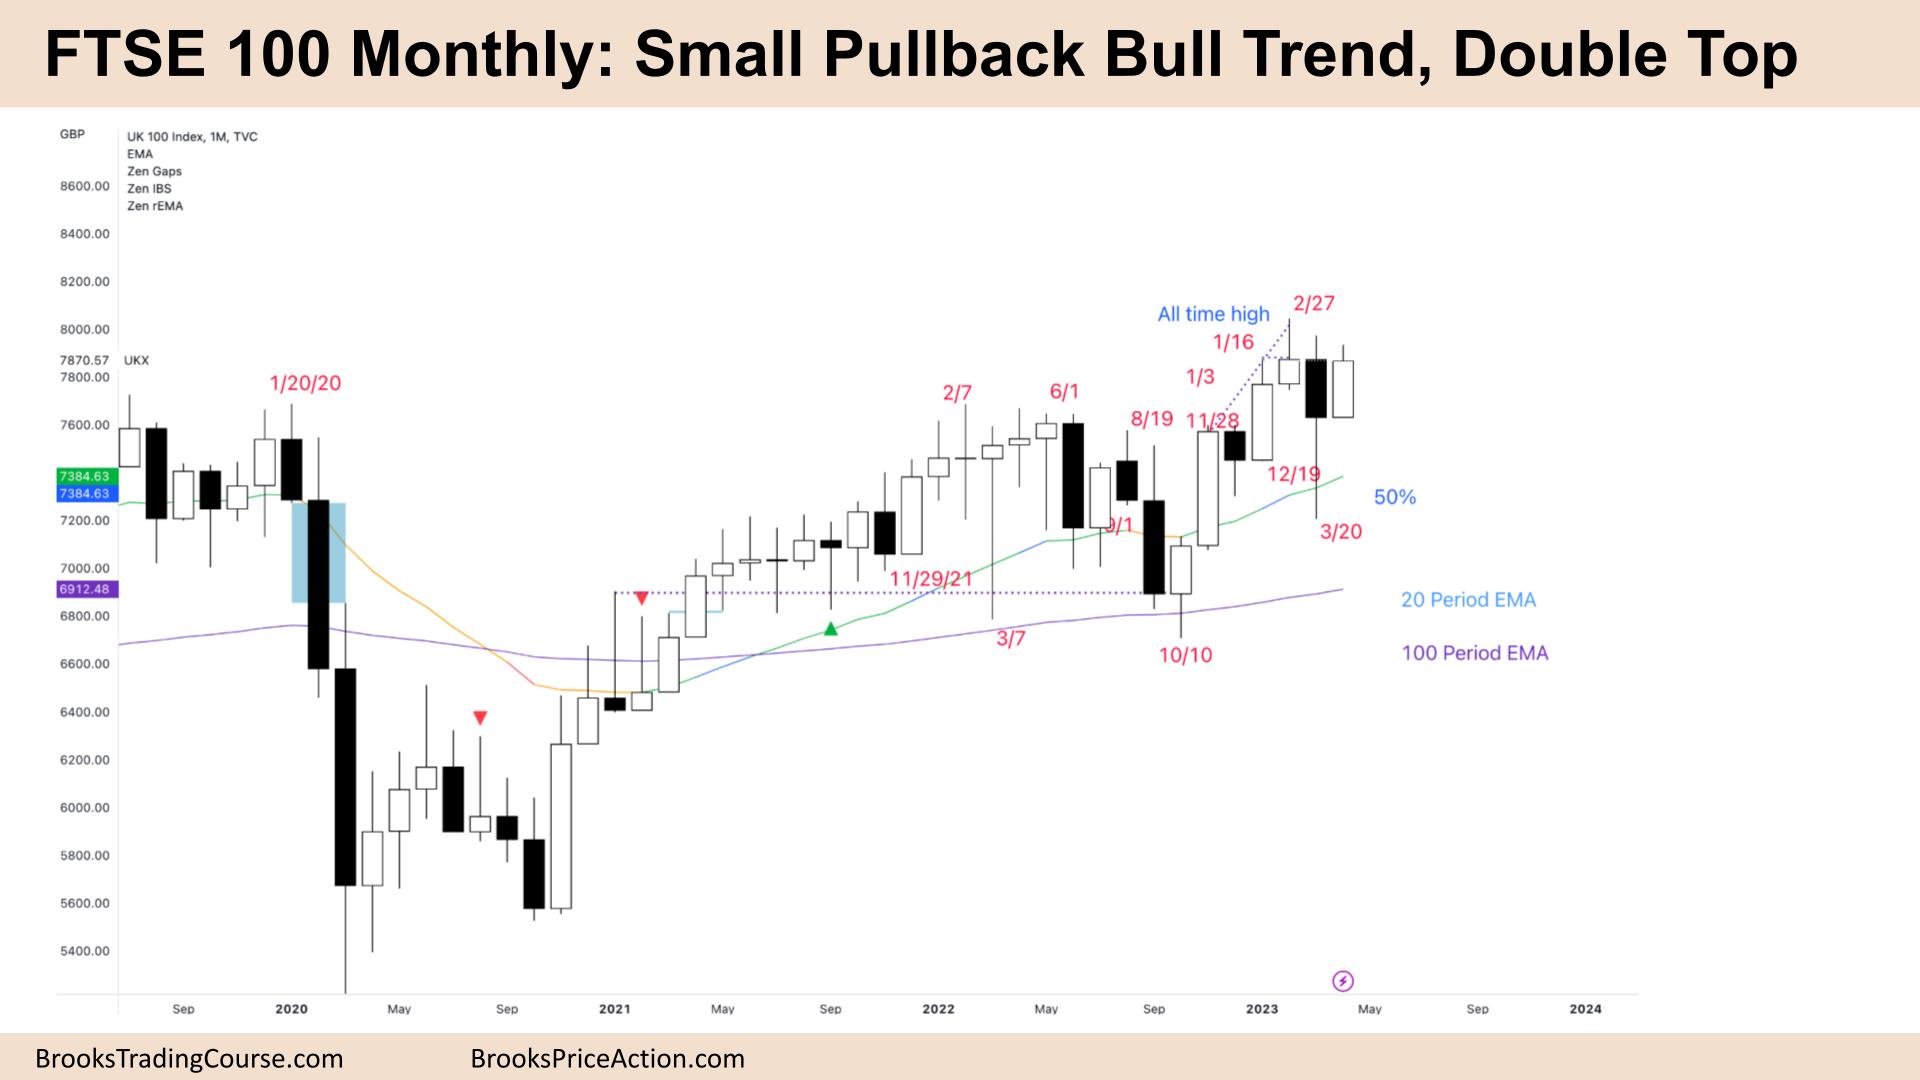
The FTSE futures market has been in a small pullback bull trend since COVID. We moved higher last month, retracing the deep 50% pullback in March. The bears are happy with the sell-off before and will look to sell above February. The bulls will buy all pullbacks to the moving average until they take a loss. Sideways for 12 months, so selling high in the trading range is a profitable strategy.
FTSE 100 Futures
The Monthly FTSE chart

- The FTSE 100 futures has been in a small pullback bull trend for some time now.
- A bull bar was closing near its high, which is a buy signal for next month.
- It is also an inside bar – no breakout above or below.
- Inside bar breakouts fail at a higher rate – so the first breakout may come back to test it.
- It is a triangle on a lower time frame, and triangles late in trend can often be final flags. Any break above this pattern will typically come back to test it before the market decides.
- The bulls see a small pullback bull trend. The 50% pullback in March was bought up. Buying the moving average (MA) in a strong trend is a profitable strategy.
- The bears see a possible lower high double top, a bear surprise last month and reasonable to sell above it.
- The bulls see it as a bull flag and want a High 1 or High 2 buy – but so far above the MA might be too much for bulls – who will want to buy lower.
- The bears see a failed breakout above June 2022 prior high – it was reasonable for bears to sell there. Because there have been at least 3 legs in this move – bears will short more aggressively.
- Bulls need a breakout above and follow-through to convince traders there is a measured move above.
- Both sides are likely to be disappointed – the structure is more similar to a broad bull channel – a sloping trading range.
- December was a bad buy signal – so smart bulls bought above there. Aggressive bears were selling, betting we would get back to test it.
- The bears want this last move up to be a wedge reversal and two legs sideways to down.
- The bulls see that March bar as disappointing, but it closed above its midpoint, so it’s technically a bull bar. The bears might need two more reversals to get a scalp back down.
- The bulls also hit a new All Time High (ATH), so there is nothing to sell yet. Bears must get a sell signal and hit s scalp target before momentum to the downside appears.
- When the signal bars are bad, but the move goes 1:1 risk reward anyway, that is a sign of a trading range.
- Expect sideways to up next month as it triggers another buy signal.
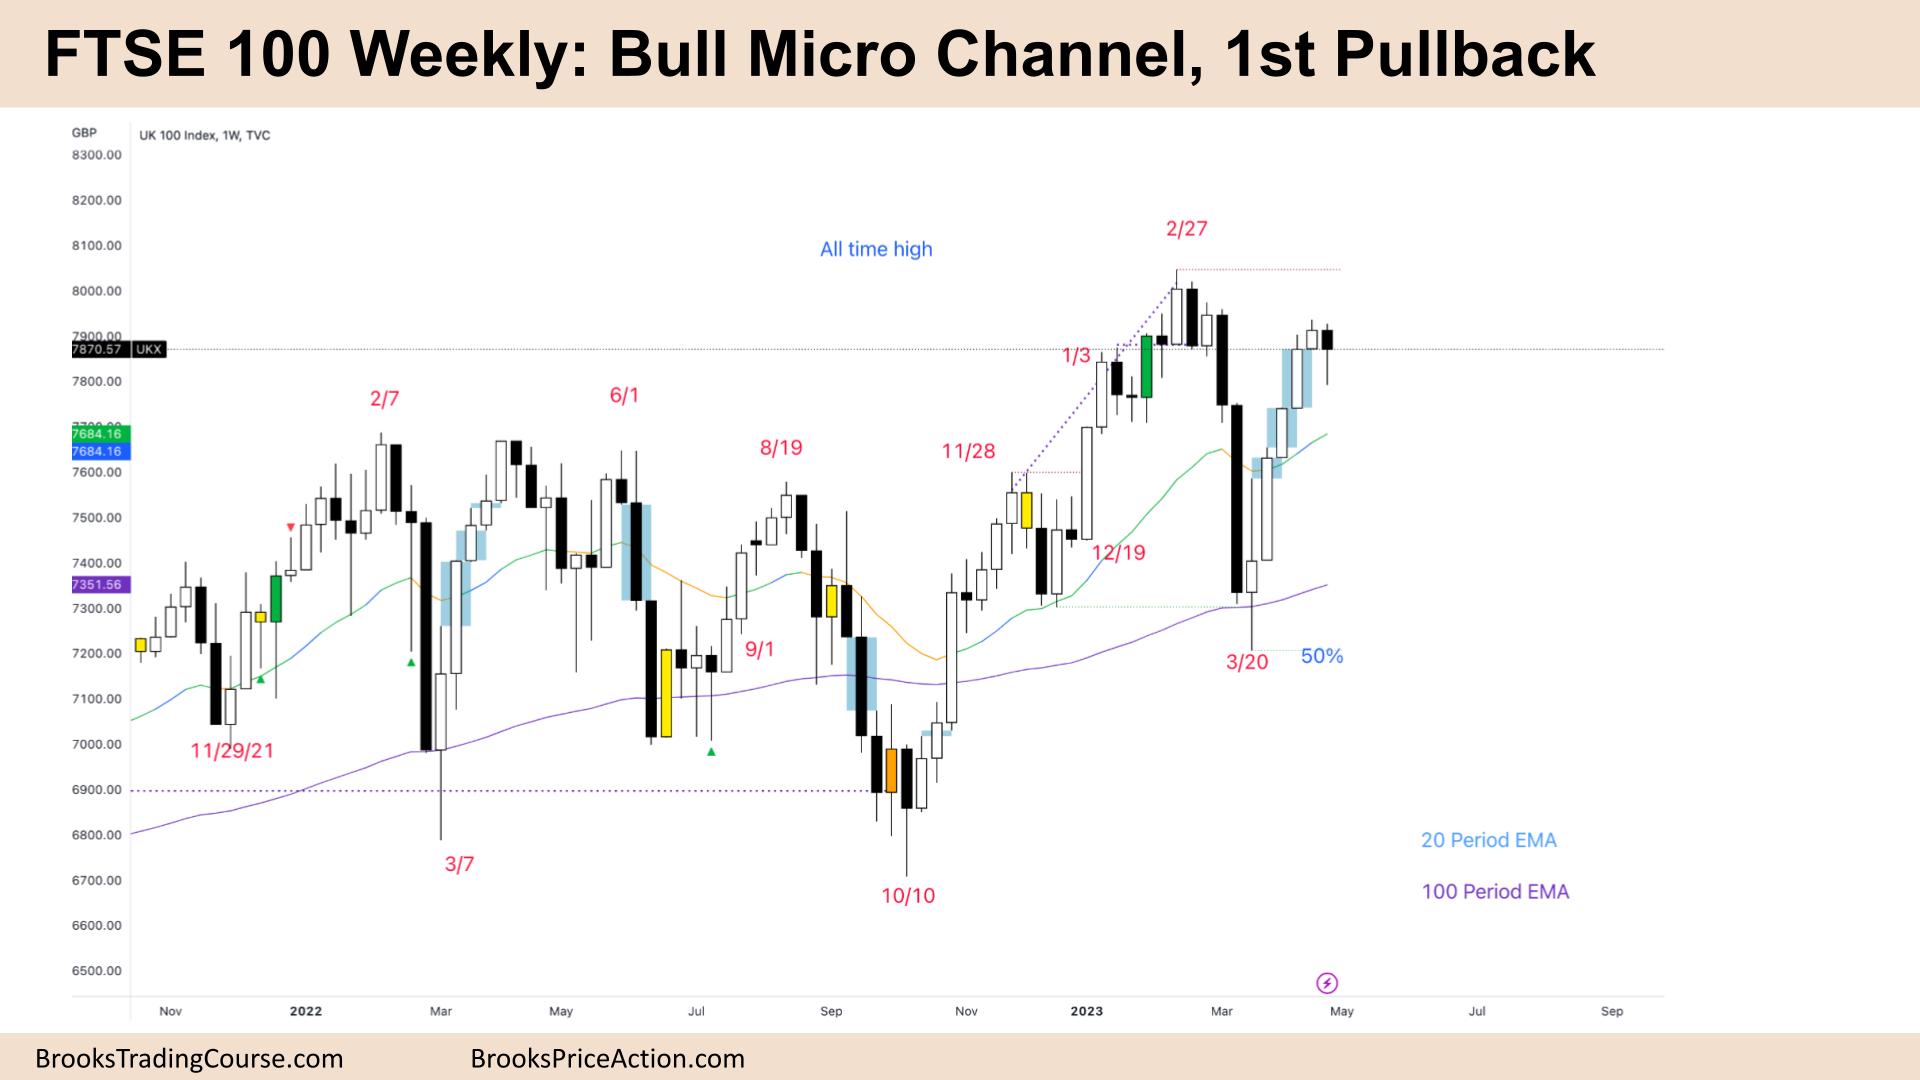
The Weekly FTSE chart

- The FTSE 100 futures on the weekly chart was a small bear bar closing above its midpoint – technically, a bull bar.
- It is a bull micro channel and the first pullback – a buy signal.
- I’ve highlighted some inside and outside bars on the chart to show the support and resistance flips.
- In February, we had an outside up bar that should have been support – that failed (the green bar.)
- When the market went down to the 50% pullback of the last leg – it came back, and we are stalling here as resistance.
- It can be a difficult trade to take – selling 4 bull bars – but aggressive bears made money last week.
- The high of the sell climax bar is also resistance, so we might have another move and pullback above – setting up a wedge reversal. The second leg of a double top is often a wedge.
- But the bulls have been making lots of money – and probably expect a second leg after such a strong micro channel. This could trap bears, and we could get back to the highs of the tight trading range above.
- The bulls see a double bottom and want a measured move above the ATH.
- The bears see a potential double top – but they need a better sell signal to make it happen. They might need two more – as this week was too strong for a sell signal – it might hit the stops of those bears.
- Smart bears will scale in higher and trade small.
- Most traders should be long or flat – exit below the low of a bear bar closing below its midpoint – so not last week. Or a scalp below any bar.
- Stops did not get hit so still on the swing.
- But the bear bar is not a great buy signal – expect sideways to up next week.
Market analysis reports archive
You can access all weekend reports on the Market Analysis page.

