Market Overview: FTSE 100 Futures
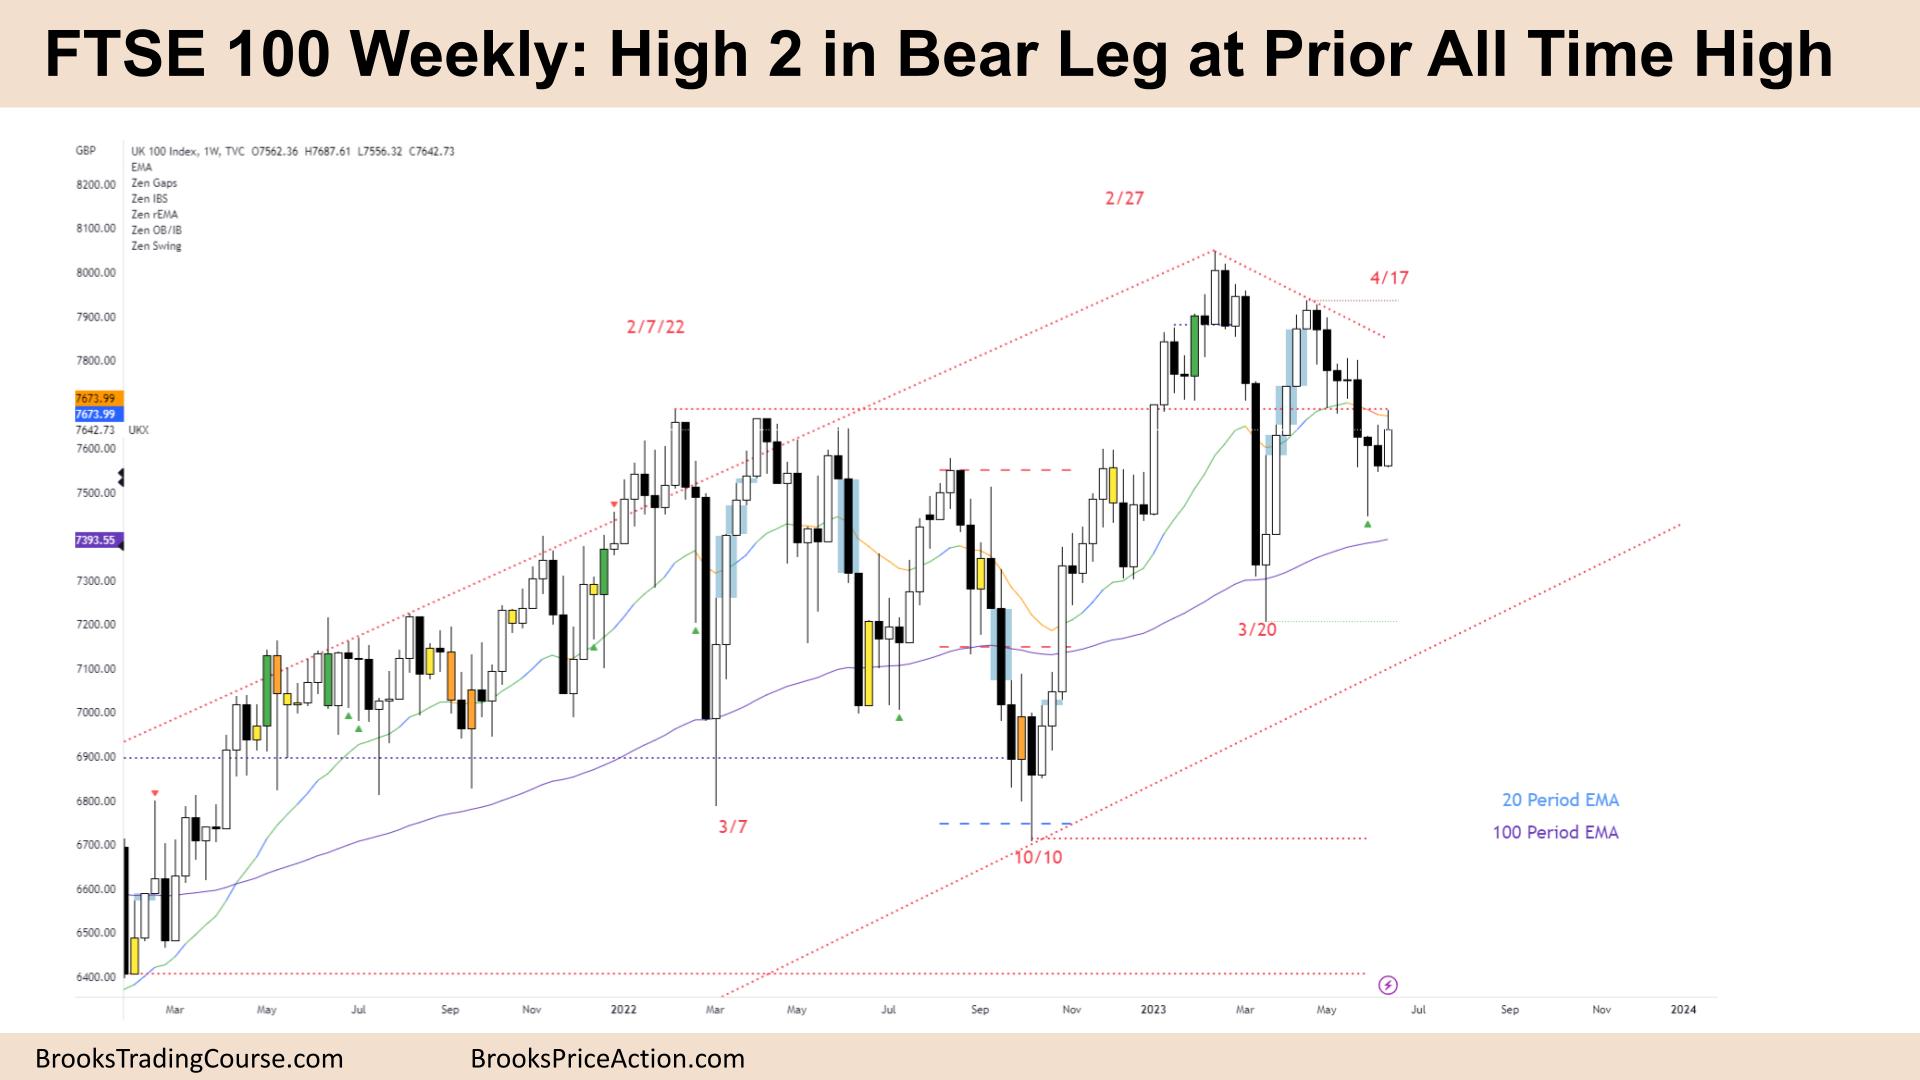
The FTSE futures market moved prices higher, setting up a High 2 with 5 days of trending lows. The bears failed to get follow-through selling at the MA, so we might need to move higher. The bull bars are not strong, and we have a bear trend line above, which should act as resistance.
FTSE 100 Futures
The Weekly FTSE chart

- The FTSE 100 futures moved higher with a bull bar with a small tail on top, a High 2 in a bear leg.
- It follows seven consecutive bear bars in a tight channel under the 20-week MA.
- Consecutive bear bars under the MA is typically a sign of always in short – but the bars have small bodies and large tails.
- The bulls see a LH DB and a High 2. The first is the current bear leg going above the high of a prior bar for the second time.
- The second larger high 2 is after the bull break above the prior ATH, which is a second reversal up. Some bulls will take a chance at the bull swing.
- The bears see a LH DT in April and want a measured move from the March low down to last October’s lows.
- We are in a triangle if there are cases for a bull and bear swing. The apex is the prior ATH around 7700. We might need to oscillate around this price further.
- The bears want to short this reversal bar when it hits the bull stops. But they see the strong bull channel before and know the trapped bulls will likely be released.
- The bulls want a follow-through bar next week, but it is less likely because it follows so many bear bars. The first reversal up is likely to be minor.
- The bulls had a very strong microchannel in March – most traders will expect a little more up.
- The bears closed the gaps from the bulls, so it is more likely a trading range – then a low 2 at the bottom of a TR is a buy. A High 2 in the top of a TR is a sell.
- Trading ranges have a lot of disappointment, so the bulls might get a big bar but mostly tail, forcing them to buy higher.
- Bears might get a bear inside bar next week.
- Always in bears, will likely get out above this week, although some limit bears will the moving average again, looking for a bit more down.
- The bulls also see 3 pushes down, so there is already a parabolic wedge in this leg, and it should get TB2L – ten bars two legs correction.
- Expect sideways to up next week.
The Daily FTSE chart

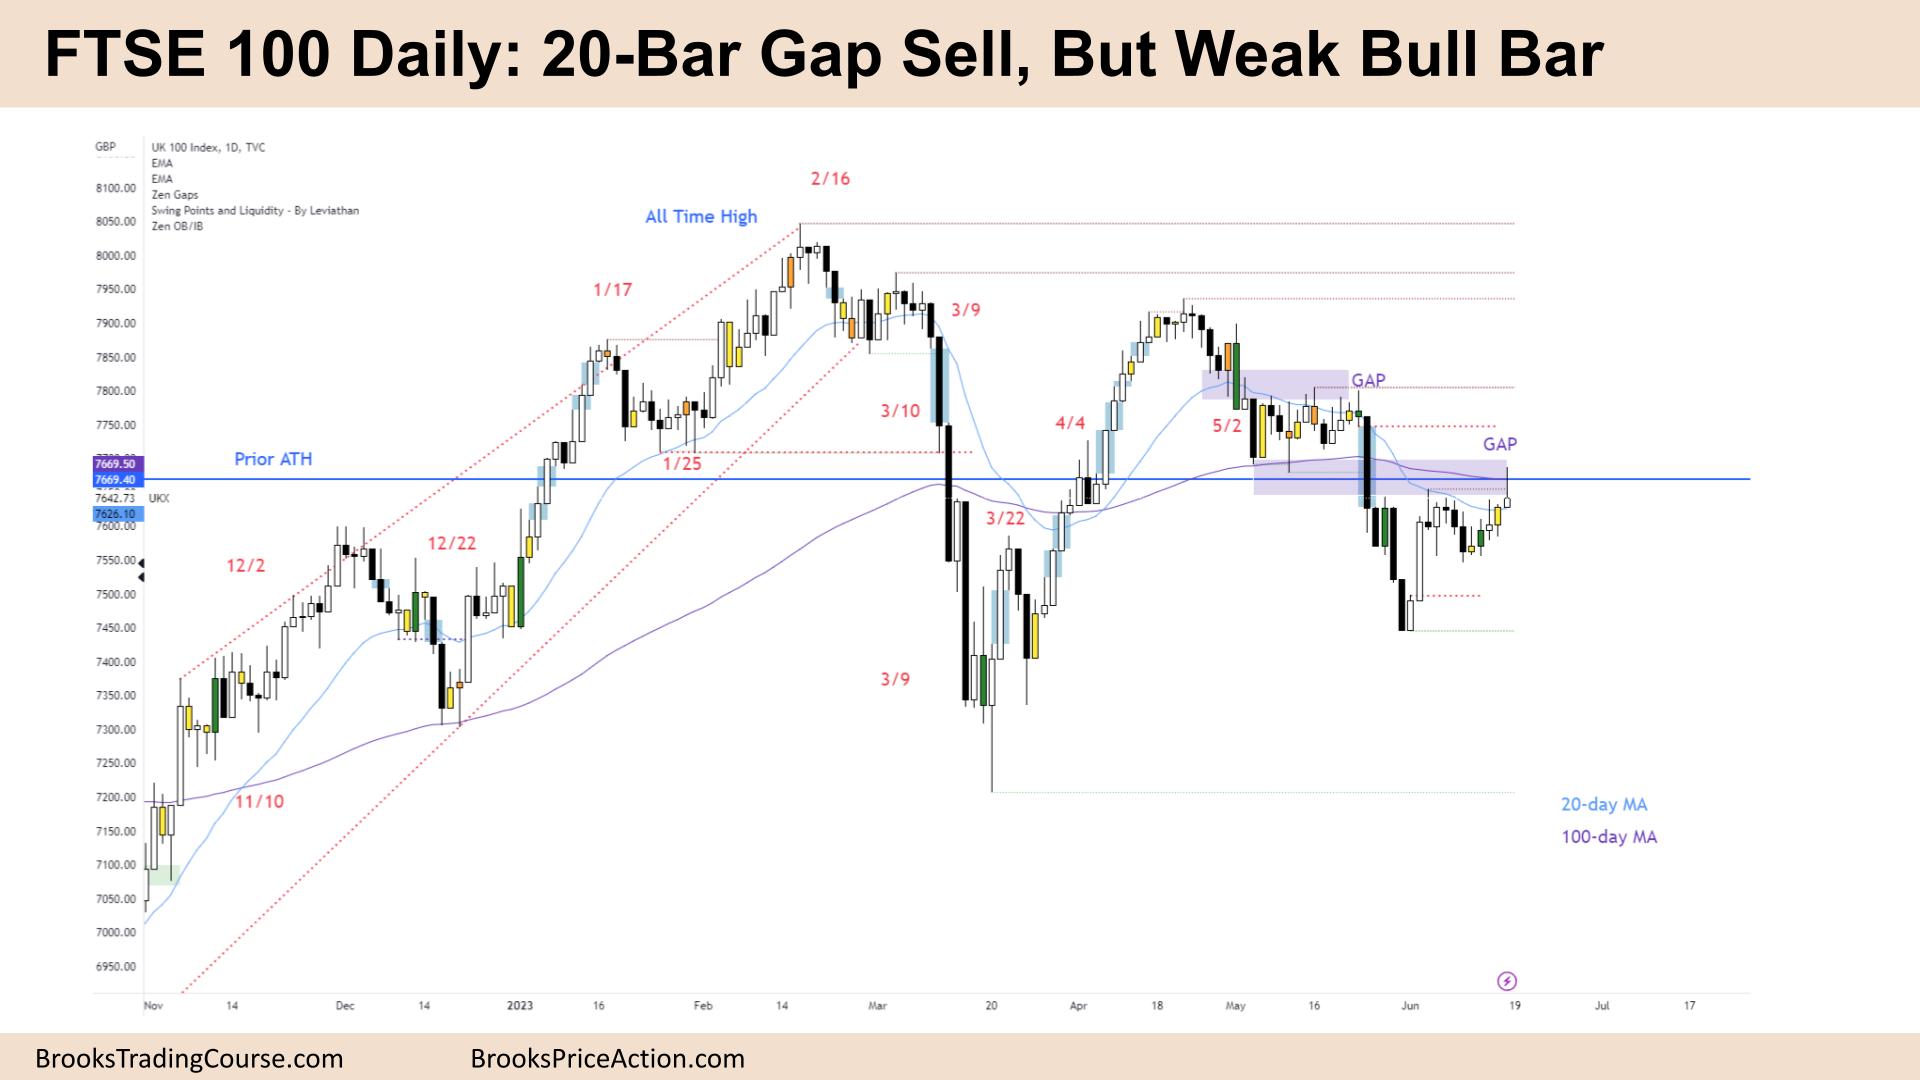
- The FTSE 100 futures moved higher on Friday with bull bar with a large tail on top.
- It is a 20-bar gap sell – the first bar in 20 to go above the MA.
- With a 3-bar bear microchannel traders will likely sell above the high and make money. Bulls want to trap them and reverse it.
- The bulls see a deep pullback from a strong rally in March. They expected 2 legs sideways to down. But this is disappointing.
- The bears see two open gaps above now and are looking for a third. They know that gaps usually close in TRs – so the two gaps above are magnets.
- The bulls want a strong break above the consecutive bull bars for a measured move up – this is reasonable because the buy orders at the MA should have worked after such a strong rally-up.
- Bears will likely sell each new high in this leg and try to create a wedge and a double top lower high – but want it below 7900.
- HTF traders buy below the 100-day MA and have made money, so we can expect them to keep doing that until it fails. That is probably why the bears are not holding into the close.
- The bears need a strong reversal bar. There are bears trapped around 7500 as the sell above a prior bar in a strong bear microchannel should work but failed.
- Expect sideways to up next week as bulls close the gap.
Market analysis reports archive
You can access all weekend reports on the Market Analysis page.

