Market Overview: FTSE 100 Futures
FTSE 100 futures moved sideways last month with a bear outside bar, unable to close below the MA in a breakout pullback. It looks like a swing-long setup, but traders have been in a TTR for a long time, so they might wait for more confirmation or urgency. Bears have been unable to get consecutive bars below the MA since COVID, so there is no reason to sell here and no good bear signal bars. Expect sideways to up.
FTSE 100 Futures
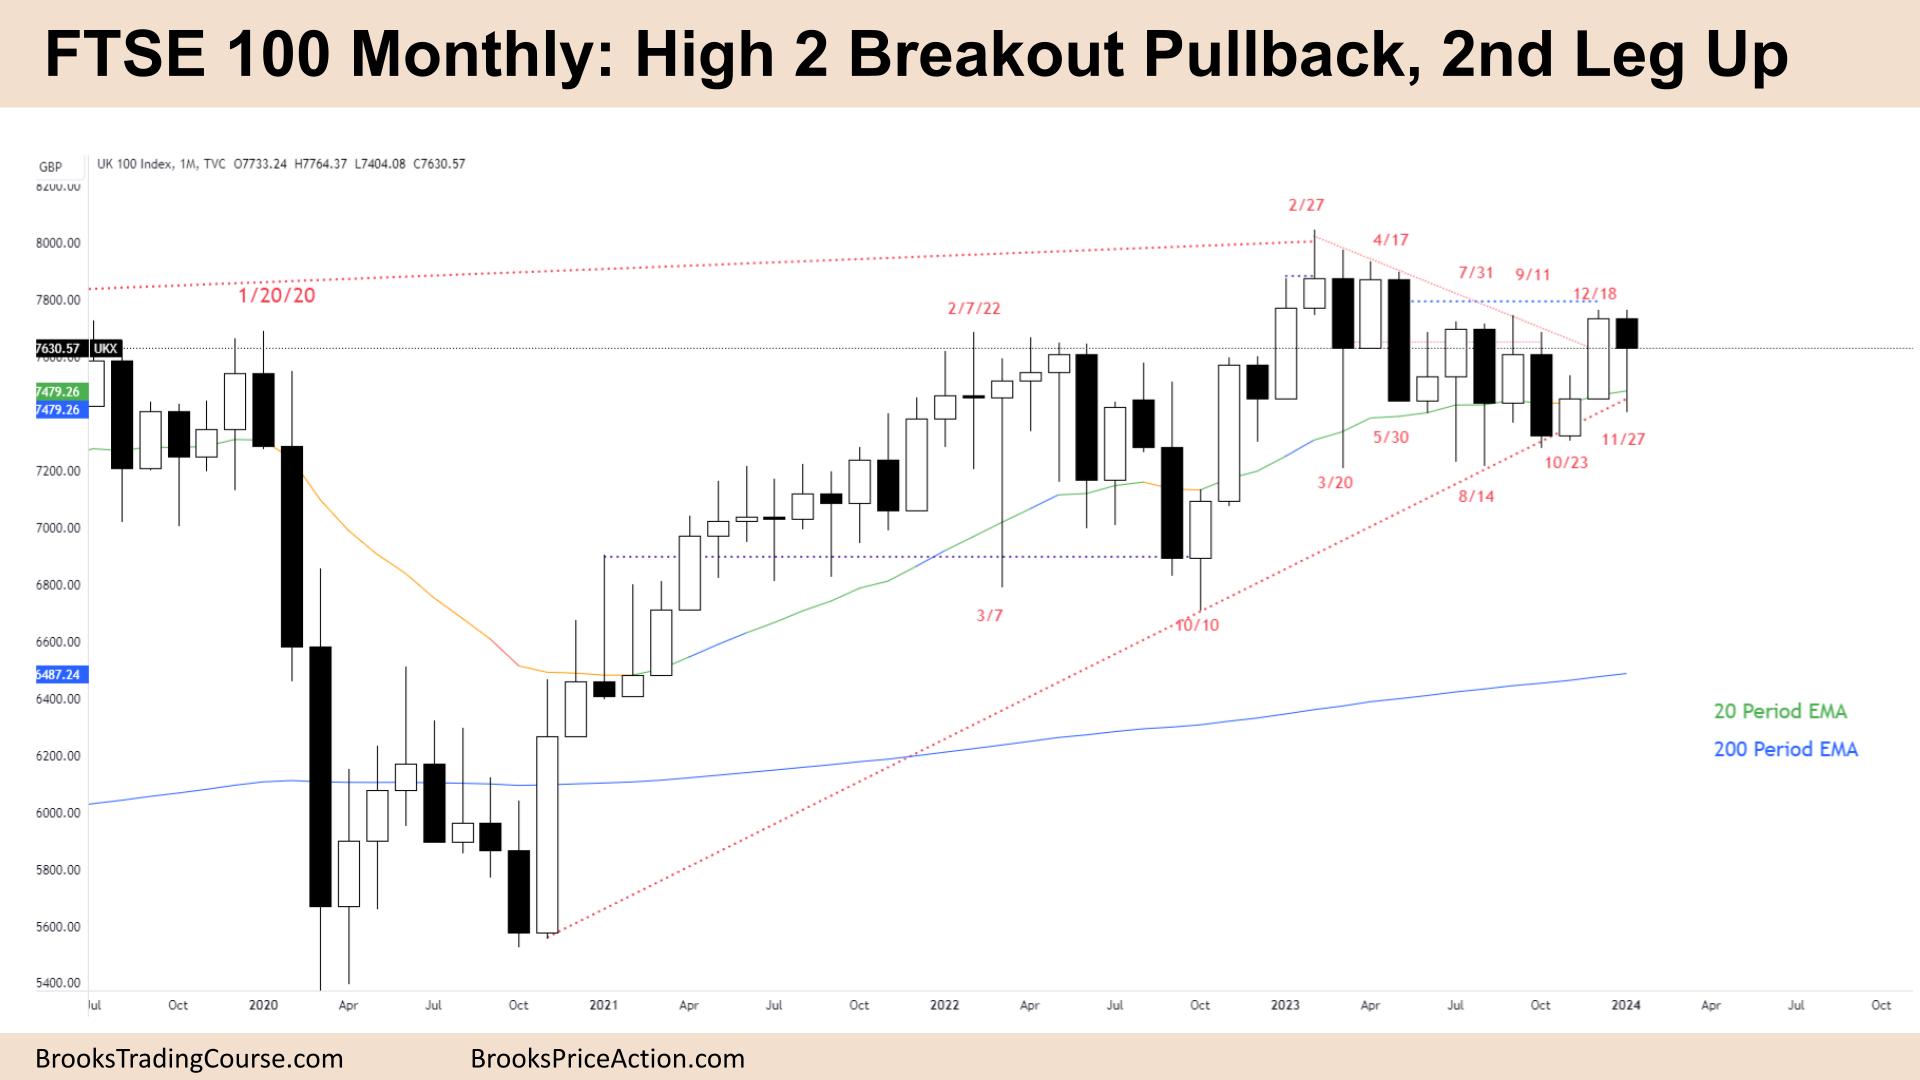
The Monthly FTSE chart

- The FTSE 100 futures monthly chart was a bear outside bar with a large tail below, a breakout pullback setup.
- The bar follows two consecutive bull bars. One was big, closing on its high, and both are above the MA. So for most traders, it is always in long.
- Because we just went always in long on the monthly chart, many traders expect a pullback to let the limit order traders out.
- The bulls see a breakout and pullback to the MA, and are expecting a second leg up.
- The bears see a double-top bear flag from February but don’t have a good signal bar. Some of those bears might sell above the bar – but its a small body, so low probability at this stage.
- It has been a tight trading range (TTR) for many months, and the first breakout fails about 50% of the time.
- It is a weak buy above a bear outside bar. Some of the bulls probably bought the pullback into the signal bar. They will buy more below the bar.
- Some traders saw July as the lower high, and we broke out of it in September. This is the second time we have gone above it, which could mean we will get a measured-move up.
- The bulls want a measured-move up to the 8200 area.
- The bears want another bear bar, for a failed breakout and close below the MA to keep it in a trading range. But another breakout pullback could finish that.
- However, they are having trouble closing below the MA, so they need consecutive bars below the MA.
- It’s better to be long or flat; expect sideways to up next month.
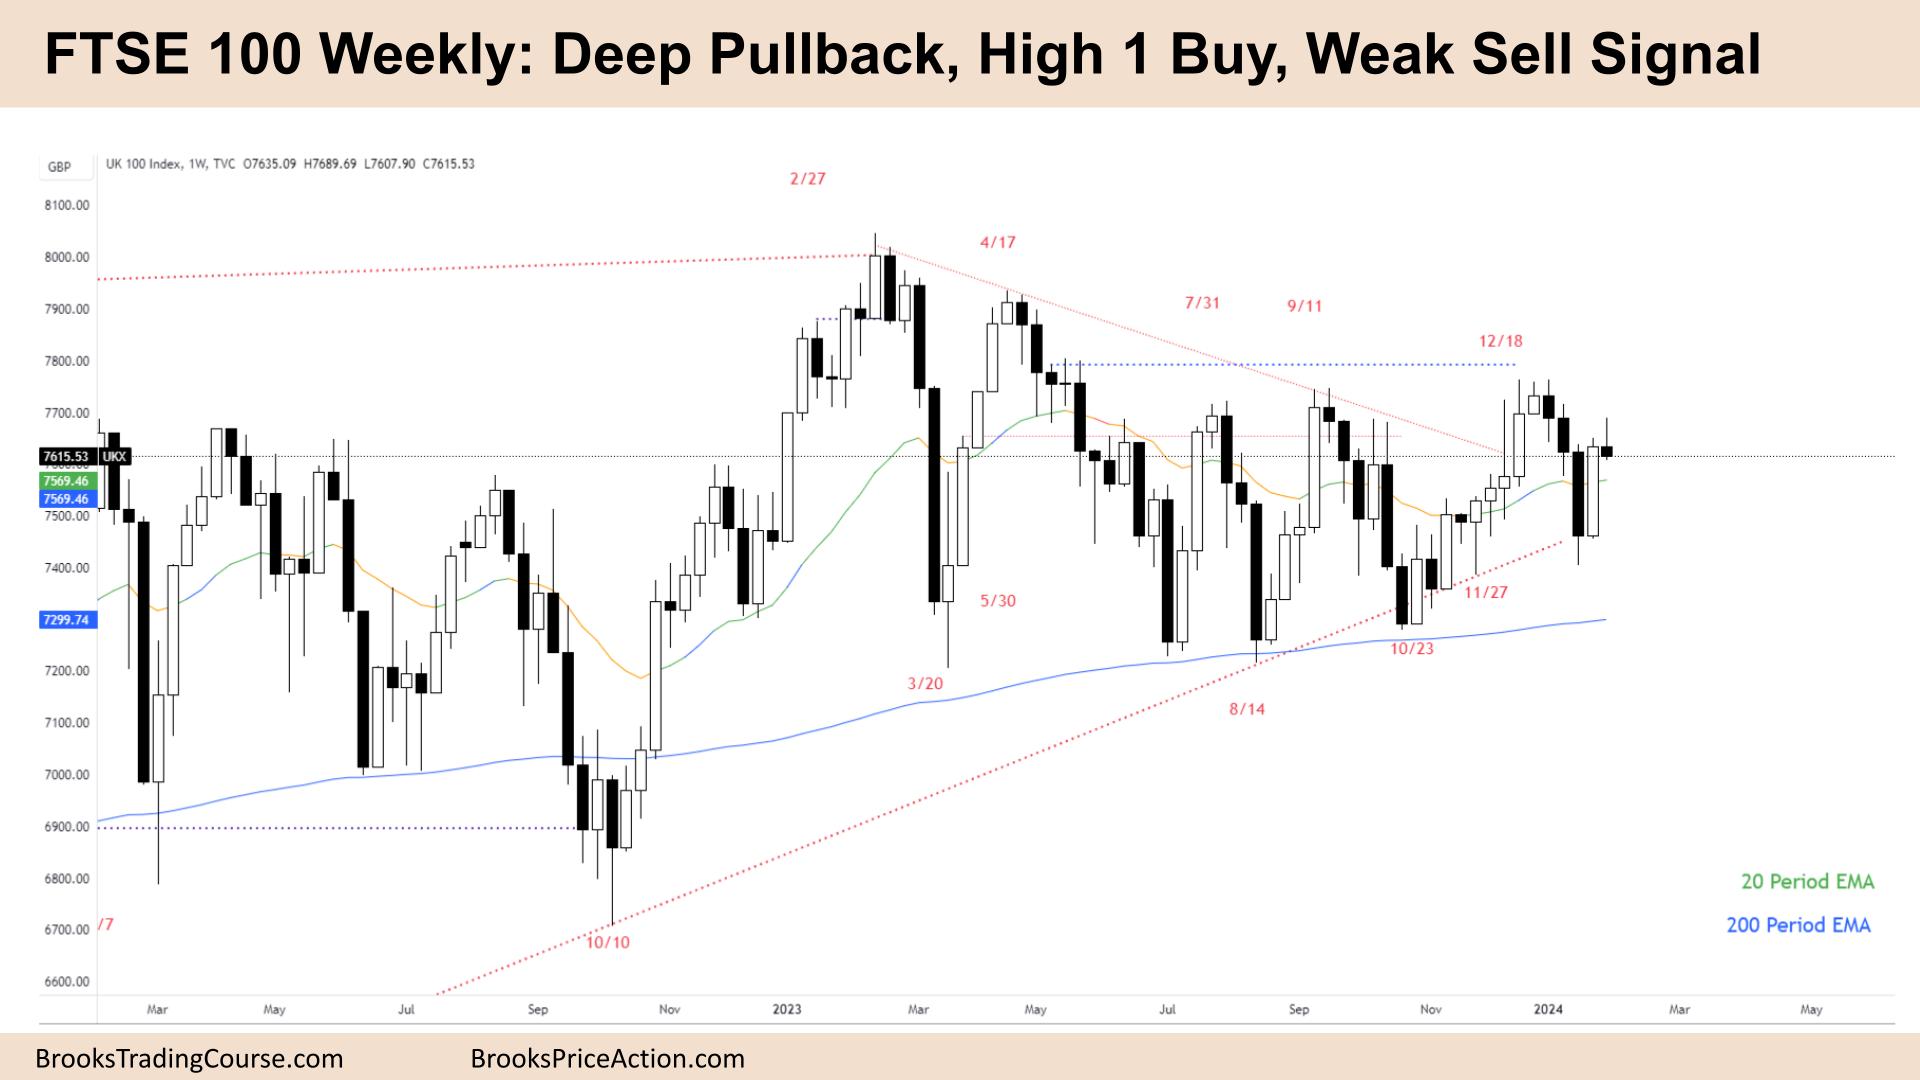
The Weekly FTSE chart

- The FTSE 100 futures weekly chart was a small bear bar closing on its low with a tail above.
- The bar is small, and small risk means low probability. So, we will probably go above and below this bar.
- The bull’s see a two-bar reversal, a strong bull bar and triggered above. They saw the bears failed to get consecutive bars below the MA and if not taking the High 1 buy, will start to buy for a High 2.
- Some of those bulls will buy into the body of that bar, so they have a 2:1 target at the prior swing high above.
- The bears see a bear microchannel with a small gap, and the bull bar comes up to test it and goes sideways. They want a second leg down.
- Most traders expected us to break out of a triangle and test the apex. Now we are moving away from it, but still with trading range price action.
- 3-bar pullbacks from the bears is not something you see in a bull trend. So we are still in a trading range.
- The bulls want a good follow-through close above the MA to make the bears give up. They will set up a measured move above the lower high.
- The bears want a second leg down back to the midpoint of the bull bar. That will prevent the bears from getting trapped as they can exit breakeven.
- If the bulls see it as a trading range, they will wait for more down to take the conservative buy. Any sign of urgency on next week’s bar could indicate a swing setup.
- Most traders should be flat in a TTR. If I had to be in, I would prefer to be long.
Market analysis reports archive
You can access all weekend reports on the Market Analysis page.

