There was bull outside candle on the monthly chart of the S&P500 Emini

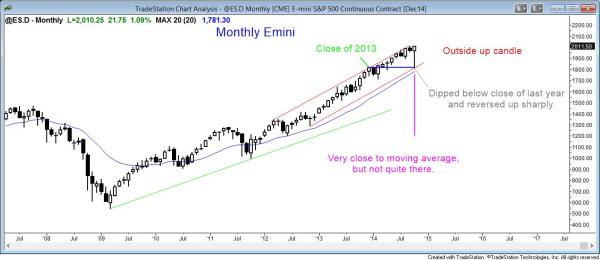
The monthly Emini chart traded above the September all-time high by 1 tick today and closed near that high. It formed a big outside bar candle.
I have talked many times about how overbought the monthly chart is, but there is no top. An outside candle late in a bull trend is more likely a sign that the market is becoming two-sided and evolving into a trading range, and less likely a sign of a breakout and a new leg up.
The monthly Emini chart is in a strong bull trend, but there is a possible double top. Whenever there is a big selloff, as there was in October, there are many bulls who want to sell once the Emini gets back to the prior high, as it did today. Many bulls who bought in September around the old high are relieved that their 10% loss is now gone and they just want to get out to take a break.
Other bulls who bought badly (near the September high) bought more on the sell off in early October. They are looking to take exit part or all of their position around their original entry. This would get them out breakeven on their first entry and with a 5 – 10% profit on their lower entry.
The bears know this and they will short here for a scalp down. Until there is a credible top, the bears will be unwilling to swing their shorts on the higher time frames.
The weekly S&P500 Emini candle chart had a bull breakout and trend reversal after last week’s moving average gap bar

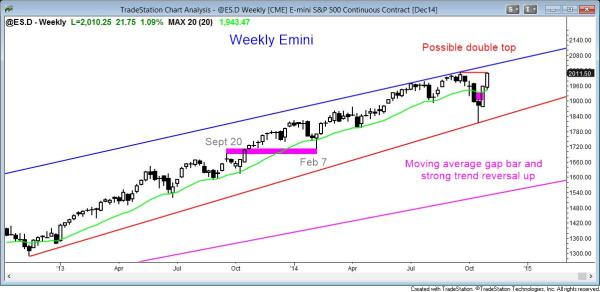
The weekly Emini chart had strong follow-through buying after the reversal up from the moving average gap bar of 2 weeks ago (high below the moving average). When that happens, the rally usually becomes the final leg up before a major trend reversal forms.
The weekly chart has a possible top, but the two strong bull candles make a reversal down unlikely without the weekly chart first going sideways for a few weeks. The bears need to build some selling pressure before traders will trust a reversal attempt.
The bulls need a strong breakout above the September high. Otherwise, the Emini will go sideways and bear bodies will accumulate. Once that happens, traders will begin to short, expecting at least a test down from the double top.
The daily S&P500 Emini candle chart is in a strong rally that is testing the all-time high

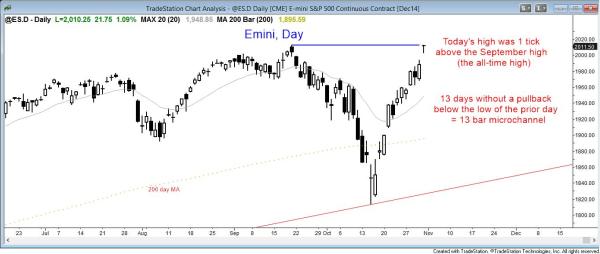
The daily S&P500 Emini candle chart is in a 13 bar bull microchannel (13 consecutive bars where the low is above the low of the prior bar). It broke above the all-time high by 1 tick.
The daily Emini chart is testing the September high. The bears want a double top. The bulls do not care if there is a pullback because the current rally is so strong that there are almost certainly buyers below. The Emini has had 13 consecutive days where they bought above the low of the prior bar. The odds are high that they will take any opportunity to buy below the low of a prior bar. However, this is unsustainable behavior and therefore climactic. This will probably result in a week or two of sideways price action because bulls will take profits and look to buy again lower. If the Emini does not trade lower after 5 – 10 bars, the bulls will simply buy at the market, expecting a bull breakout.
This rally is so strong that the odds are the the Emini will break above the September high and that the bears will need at least a week or two to create a credible top. If the Emini does go above the September high and then falters, it would set up a large expanding triangle top. However, until there is strong selling pressure, traders will assume that any pullback will be bought and that the Emini will go higher. Most tops fail. What the bears have in their favor is how overbought the monthly chart is. However, they need a credible top AND a strong bear breakout. Until they get that, traders will continue to buy even small pullbacks.
Traders can see the end of the day bar-by-bar price action report by signing up for free at BrooksPriceAction.com. I talk about the detailed Emini price action real-time throughout the day in the BrooksPriceAction.com trading room, and a 2 day free trial is available.
When I mention time, it is USA Pacific Standard Time (the Emini day session opens at 6:30 am PST, and closes at 1:15 pm PST). You can read background information on the intraday market reports on the Intraday Market Update page.

