Monthly S&P500 Emini futures candlestick chart: Finally pulled back to the moving average
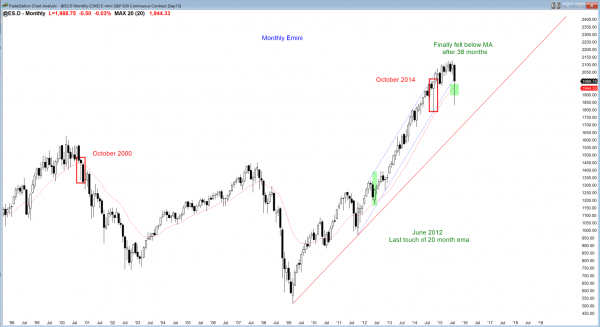
The monthly S&P500 Emini futures candlestick chart pulled back to the moving average and found “20 gap bar bulls”. Will this be more like October 2000 or October 2014?
The monthly S&P500 Emini futures candlestick chart found 20 gap bar bulls at the moving average. Even though the 38 months above the moving average was climactic, there are always buyers on a pullback to the moving average if the market is strong enough to stay above the moving average for 20 or more bars. This means that there was a gap between the moving average and the low of each of the past 20 bars (actually, 38 bars). The bulls waiting to buy a pullback to the moving average are “20 gap bar bulls.”
The Emini was above its monthly moving average for 38 months. The cash index has only been above its moving average for longer that this once in the past 50 years. In 1997, it held above for 38 months, and then corrected 22% at 44 months. The one other time that it held above for 38 months was 1987, and it then crashed down 38%.
I have repeatedly written that the odds were 80% that there was going to be limited upside this year until after a pullback below the monthly moving average, which finally happened this week. Staying above the moving average for many bars is unsustainable and therefore climactic behavior.
What typically follows a buy climax? A trading range is most likely. Although there is a natural temptation to compare this selloff to the one in October 2014, there are differences. The most important one is that the current pullback is in an extremely overbought market. Will one bar down be enough to correct the overbought condition? Probably not. However, 2 – 10 bars will be enough.
Why not compare this month to October 2000? That was also a big selloff and the bear breakout bar closed above its midpoint. However, unlike October 2014, a huge selloff followed.
So which October will this current selloff resemble? Probably neither. The rally is strong enough so that the risk of a big selloff without first entering a trading range is small. The buy climax was extreme enough so that the chance of an immediate resumption of the bull trend is small. The bulls will probably be hesitant to hold long-term positions for at least several bars on the monthly chart, which means that they will take quick profits for at least a couple of months. That lack of conviction will probably limit the upside for the next couple of months.
The bar on the monthly chart was huge, and Monday is the final day of the month. August will probably close in the middle third. Give how big August was, there is probably a 60 – 70% chance that September will be an inside bar. This means that it will not trade above the August high or below the August low. An inside bar is a trading range bar, and that will extend the trading range to a 2nd month.
Weekly S&P500 Emini futures candlestick chart: Bears disappointed by no follow-through selling
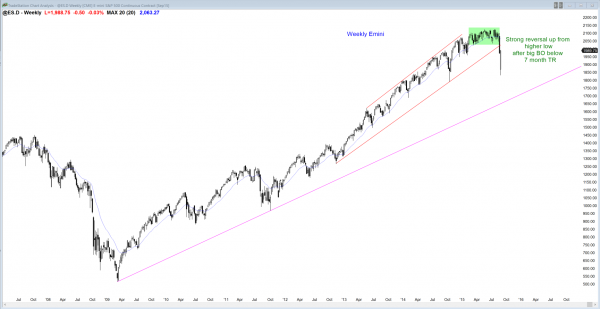
The weekly S&P500 Emini futures candlestick chart broke strongly below its 7 month trading range and 2 year bull channel, but reversed up sharply this week and is testing the breakout points.
The weekly S&P500 Emini futures candlestick chart disappointed bears by having a big bull reversal this week instead of a follow-through bear bar. Disappointment is a hallmark of a trading range. Even though the reversal up from above the October low is bullish, it leaves bulls and bears confused. Confusion is the other hallmark of a trading range. When traders are disappointed and confused, they tend to buy low, sell high, and scalp, and this behavior creates a trading range.
While it is possible that this reversal up leads to a strong breakout to a new all-time high, it is more likely that the bears will sell once it gets near the bottom of the 7 month trading range. Bulls who failed to exit as the selloff began will look to sell out on a rally to reduce their losses. With both bulls and bears selling, the odd are that the reversal up will fail. If it does, it could create a major trend reversal, like a head and shoulders top.
Daily S&P500 Emini futures candlestick chart: Learn how to trade trading range price action
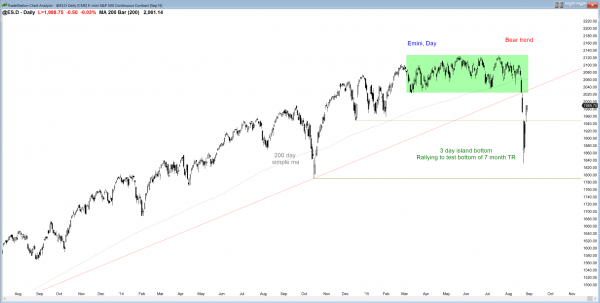
The daily S&P500 Emini futures candlestick chart reversed up sharply from above the October low, and has retraced more than 50% of the bear trend.
The daily S&P500 Emini futures candlestick chart is in a bear trend, but it is also rallying strongly up from a double bottom with the October low and a 3 day island bottom. As strong as the current rally has been, unless the bulls are able to move the Emini above the top of the current bear leg at 2100, this rally is at best a bull leg in a developing trading range.
The bears took windfall profits this week. Most of the bulls who bought will also probably take windfall profits over the coming week, and the bears will come back to sell again when the Emini gets to around the bottom of the 7 month trading range, which is around 2050.
V bottoms are extremely rare and are almost always something else. The one from October was a parabolic wedge sell climax. The current one had no pause on the way down, and that lack of buying pressure during the bear phase will make most bulls hesitant to hold onto their positions. They will want to see a test down to around the lowest close of the selloff, which occurred on August 24 and it was at 1871.25.
The current rally could last for weeks, but the odds are that bears are scaling in because they have a strong belief that the Emini will test that lowest close before it goes above the top of the bear leg, and they are probably right. Once it tests that close, traders will pay attention to what happens there. Will it collapse below the close? If so, the Emini will probably fall below the October low, and the correction will probably be around 20%. This happened in 1997 after the last time the S&P was above its moving average for this long. If instead it hesitates at the lowest close, it might form a double bottom there, which could be a major trend reversal and the end of the bear market on the daily chart.
Because the monthly chart is so strongly bullish, this bear market on the daily chart will probably be just a bull flag on the monthly chart, even if the selloff is 20%. However, if it does reach 20%, the correction and recovery will probably last many more months before the bull trend resumes.
Can this be the start of a bear trend on the monthly chart? That is unlikely. However, traders will watch the current rally on the daily and weekly charts to see if it begins to form a right shoulder of a head and shoulders top. Although the chance of a trend down from a top is usually only 40%, traders will be ready to sell for a swing trade if there is strong downside momentum. Most tops fail to reverse the market and instead become bull flags. It will take at least a couple of months before the bears know if they will have their top.
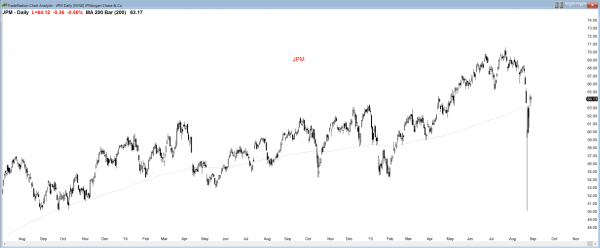
The daily chart of JPM and many other stocks have probably seen the low of the selloff, even though this is less certain for the S&P cash index and most stocks.
Even though it is unclear whether the Emini has seen the low of this bear trend, many stocks almost certainly have seen the low. JPM is an example. The selloff was exceptional, but so was the reversal. When the bulls are that eager to buy such a severe selloff, the odds are high that they will buy any further selloff, and that they will buy well above this week’s low. The best the bears can realistically hope to see over the next many months is s test down.
Traders can see the end of the day bar-by-bar price action report by signing up for free at BrooksPriceAction.com. I talk about the detailed Emini price action real-time throughout the day in the BrooksPriceAction.com trading room, and a 2 day free trial is available.
When I mention time, it is USA Pacific Standard Time (the Emini day session opens at 6:30 am PST, and closes at 1:15 pm PST). You can read background information on the intraday market reports on the Intraday Market Update page.


Al, I am forming the view that this selloff, is quite different from the previous ones (such as October 2014 for example) occurring, as it is, in the context of a 6 month tight trading range, declining corporate earning growth and increasing global financial stresses. All recent selloffs had a V-shaped rebound as they occurred in a raging bull market (helped by well timed FED official comments along the way). The market should therefore head lower over the next few months. But as I watch the screen every day I can’t help but think that someone out there (with a lot of firepower) is intervening quite regularly in the markets. The latest example? The 40+ point plunge and 40+ point rise (within 2 hours) in the E-mini starting at 13:30 ET on 27th August was highly suspicious and a candidate for just such manipulation. That’s why I am now a convert to price action trading – logic has nothing to do with it and one should not try to forecast market direction in order to be profitable – do you think that such manipulation exists? And is it powerful enough to affect the outcome of market forces in the longer run? (by the way, thanks for all your very clear comments daily and on this weekly analysis. I have learnt an enormous amount from your price action course and am day trading for a living.)
I know that conspiracy theories come up during political campaigns, but they are all false. All good traders understand that the mkt constantly searches for the “right” price where both the bulls and bears are equally satisfied and dissatisfied. It has to probe too far to know what is far enough.
When it becomes increasingly clear that a particular support or resistance level will be hit, the mkt can get vacuumed there very quickly. For example, if there is a support level, why would the bulls buy as the mkt is falling when they know they soon can buy lower, at support? Why would the bears wait to sell a pullback when they know the mkt is in a free fall, and when it reverses, the rally will be a new bull trend and not a bear flag? The result is an abrupt reversal. When a sell vacuum and a reversal are occurring during an emotional time, like a reversal in a buy climax on the monthly chart, the moves will be big because the support is on the monthly chart and monthly bars are big.
So, is it a conspiracy if all the firms do the same thing at the same time? No, because they did not conspire. They all see what is logical and place similar trades. The big moves provide an opportunity to make a lot of money in a brief time, and smart firms are eager to place the trades.
No two or three firms could get together to create the moves because there are hundreds of big firms and countries (Saudi Arabia trades stocks) that are many times larger and cannot be pushed around. Also, the firms would be indicted in no time, if they tried.
Hi Al,
Thank’s for your analysis and the possibilities that exist for both bull and bears.
When you mention, “bulls eager to buy this sell off”. I was wondering how could one decipher how much of the rebound was large short positions covering and how much of it was bulls joining in on that covering process. The fact that there has been further buying after the 2 reversal sessions tells me that bulls are joining in now.
I agree it will be interesting to see what happens if price tests bottom of trading range.
It is impossible to know how much is caused by bulls or by bears buying. Both are taking place. The bears knew the Emini was going to fall to the average price. When it fell below it so quickly, they got many months of profit within days. They would be foolish not to buy back their shorts. Also, smart bulls saw the selloff as a brief chance to buy at a great discount with little risk. The monthly chart is in a strong bull trend and it is very unlikely to reverse to a bear trend in one bar.
What is different now is that the market cycle has changed. Instead of a tight channel on the monthly chart, there was a buy climax and now a pullback. A pullback from a buy climax usually lasts about 10 bars, which is about a year. I do not know if this is the start of a year long trading range, but the odds favor a trading range for several months.
The abrupt reversal up tells everyone that there are buyers below. Bulls will buy selloffs and bears will take profits. The strong selloff tells everyone that traders want to sell higher. Bulls will take profits on rallies because they doubt the bull trend will resume soon. Bears will short because they are confident that there will not be a bull breakout.
With both bulls and bears buying low, selling high, and taking quick profits, what will the chart look like? A trading range, and that is what is most likely for the next couple of months at least. There will be sharp rallies and scary selloffs, but they will reverse and disappoint traders who believe they are the start of trends. Smart traders know that the odds favor failed breakouts and reversals.