Monthly S&P500 Emini futures candlestick chart:
Bull trend losing momentum
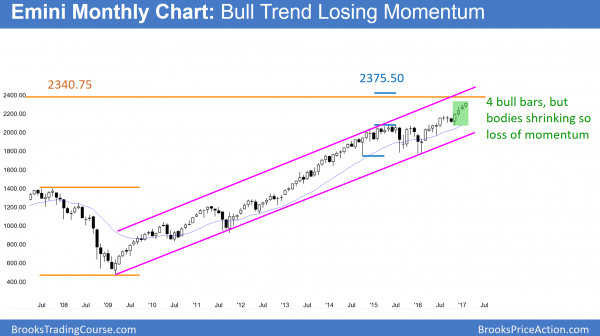
The monthly S&P500 Emini futures candlestick chart currently has 4 consecutive bull trend bars. Yet, the bodies are shrinking and it is at the top of a protracted tight bull channel. While it might reach the measured move targets before pulling back, the odds favor a pullback first.
The monthly S&P500 Emini futures candlestick chart has been in a bull trend for 8 years. Because it is breaking above a 2 year trading range late in a bull trend, there is a risk of a Final Flag reversal. Yet, there is no credible top.
Since the 12 month channel is tight, the odds are that bulls will buy the 1st reversal down. Hence the downside risk is not big over the next few months. There is support at the August bull flag high. That is therefore also a magnet. Hence, the odds are that the Emini will pullback below that high within the next few months.
Low 4 consecutive tops this spring?
Since the 1st bear break below a tight bull channel usually leads to a bull flag, the odds are that traders will buy the pullback for at least one more leg up. Because there are measured move targets between 2340 and 2375, the odds are that there will not be a big correction before the Emini reaches those magnets. If it turns down at that point, it would be a Low 4 top. This would therefore be consecutive tops (low 2, then a breakout, and another Low 2). Since consecutive tops have a higher probability of reversing down, the odds of a pullback to 1800 would go up if the monthly chart creates a Low 4.
Weekly S&P500 Emini futures candlestick chart:
6th consecutive bull trend bar
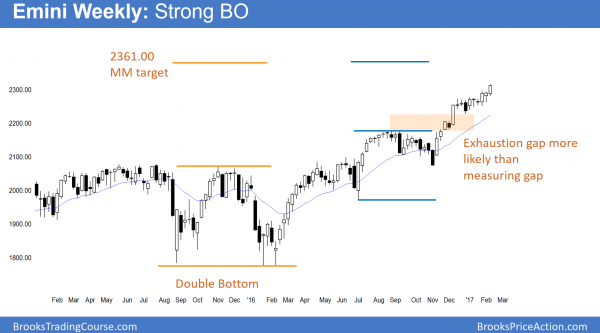
The weekly S&P500 Emini futures candlestick chart had its 6th consecutive bull trend bar this week. Because that is unusual, the odds favor a bear trend bar within the next week or two. While there is no top yet, there is a gap between this week’s low and the January 6 high. When a rally lacks consecutive big bull trend bars, gaps usually close. Hence, the Emini will probably fall below that high within the next few weeks.
The weekly S&P500 Emini futures candlestick chart is in a bull trend. Six consecutive bull trend bars is a sign of strong buying. Therefore, bulls will probably buy the 1st reversal down. Hence, they will probably buy around the support of the December 30 higher low.
Since there is also a gap above the August trading range high, the odds are that the Emini will fall below that high within a few months. When a bull trend has lasted 20 or more bars like this, gaps usually close before the Emini reaches its final targets. Hence, bulls will probably buy a 130 point pullback.
Close of 2016 not tested
In addition to testing the August trading range high, that would also test the close of last year. Whenever the Emini rallies from the start of the year, it usually pulls back to test the close of last year. Hence, that is another magnet that is pulling on the current rally.
Daily S&P500 Emini futures candlestick chart:
Emini wedge top creating 5% 130 point stock market correction
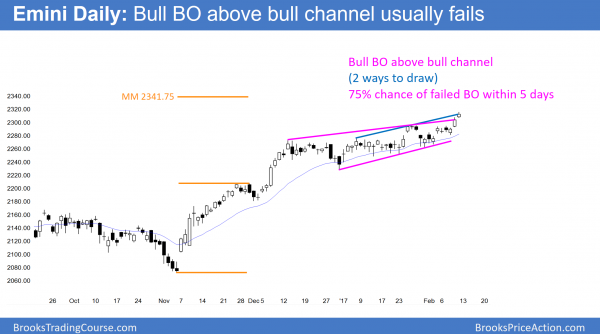
The daily S&P500 Emini futures candlestick chart had its 3rd leg up after the strong early December breakout. Hence, it has now completed a Spike and Channel pattern.
The daily S&P500 Emini futures candlestick chart has a rally that is a wedge top. It broke slightly above the bull channel on Thursday. There is only a 25% chance that Thursday’s breakout will continue and begin a new market cycle. That would be a breakout, a channel, and then a trading range. Hence, there is a 75% chance that the breakout will fail within about 5 days. Once it reverses, the target is the bottom of the channel. Hence, around 2280.
Wedge top
A wedge top’s minimum goal it TBTL Ten Bars Two Legs sideways to down. It usually tests the bottom of the channel. Therefore, it probably will test the December 20 pullback low of 2228.
5% correction to August high
Finally, there is still a gap above the August trading range high. If the Emini falls for a measured move down based on the height of the wedge, it would close the gap.While there is a 60% chance of a drop to the December 30 low within the next 2 months, there is better than a 50% chance that the selloff will continue down to just below the August high as well. That would be about a 5% correction of at least 130 points.
The bull case
While the odds favor a correction before the Emini reaches its target of 2375, there is still a 40% chance that it will continue up without a significant pullback. About 25% of the breakouts above bull channels are strong and have at least 2 legs up. The bulls will need one or more big bull trend bars over the next few days to increase the odds of a sustained rally.
Traders can see the end of the day bar-by-bar price action report by signing up for free at BrooksPriceAction.com. I talk about the detailed Emini price action real-time throughout the day in the BrooksPriceAction.com trading room. We offer a 2 day free trial.
When I mention time, it is USA Pacific Standard Time (the Emini day session opens at 6:30 am PST, and closes at 1:15 pm PST). You can read background information on the intraday market reports on the Intraday Market Update page.


