Monthly S&P500 Emini futures candlestick chart:
Should test below 20 month EMA around 2480
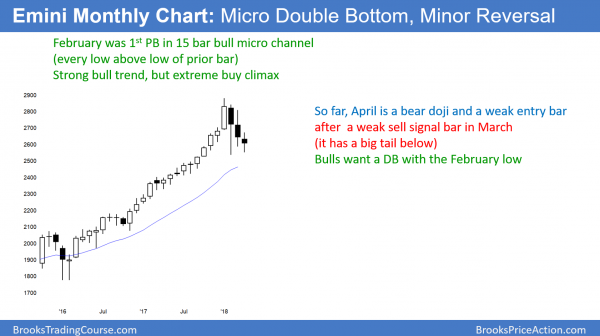
The monthly S&P500 Emini futures candlestick chart has pulled back for 3 months after an extreme buy climax. There is no bottom yet, and the 20 month exponential moving average around 2480 is a magnet below.
The monthly S&P500 Emini futures candlestick chart has pulled back for 3 months in a strong bull trend. There were 15 consecutive months where every low was above the low of the prior month. This was the longest micro channel in the 100 year history of the stock market.
A micro channel is unsustainable and therefore climactic. Since this is the most extreme micro channel buy climax in history, the correction might last longer and fall deeper than what usually happens in a strong bull trend. The typical pullback after a 5 – 10 bar micro channel lasts 1 – 3 bars. Since this streak is longer, the bulls are probably more exhausted. It therefore might take them more time before they are willing to buy aggressively again.
I wrote last weekend that this week would trade below the March low and probably try to reverse up. It tried, but did not reverse up strongly. In addition, this week’s low is getting close to the 20 month EMA. It is close enough so that it probably cannot escape the gravitational pull of that support. Consequently, there is now at least a 50% chance of the selloff falling below the 20 month EMA. Furthermore, there is a 40% chance of the Emini falling 20% and the correction lasting 6 months.
Monthly support levels
The next support is the 20 month exponential moving average, which is currently around 2480. A test would probably fall at least 30 – 100 points below. The support below that is the start of the parabolic bull channel. That is the March 2017 low of 2321.75.
A strong break below that would then test the bottom of the 15 month buy climax. That is the November 2015 low of 2074.50, which is also at the top of the 2014 – 2015 trading range. There is currently only a 20% chance that this selloff will get there before resuming up to test the all-time high.
Finally, the bottom of that range is around 1800. While the Emini will probably test that level within 5 years, it is unlikely to get there this year.
Weekly S&P500 Emini futures candlestick chart:
Emini weak double bottom, but double top bear flag and Trump’s China trade war
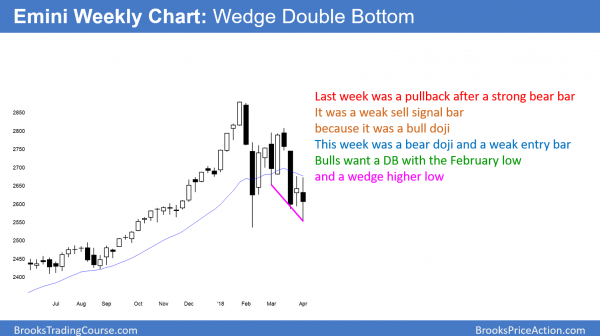
The weekly S&P500 Emini futures candlestick chart reversed up modestly this week after falling below last week’s low. It is the 2nd consecutive doji bar and therefore not strongly bearish.
Last week was a pullback from a huge selloff from a Low 2 bear flag. However, last week was a bull doji. It was therefore a weak follow-through bar and a weak sell signal bar. This week was the entry bar below that 1 bar bear flag. Since this week had a big tail below, it was not strongly bearish. Furthermore, it closed above last week’s low, and its low was above the February low.
While the past 2 weeks have not been particularly good for the bears, they have not been good for the bulls either. The bulls want a double bottom with the February low. In addition, they also have a 6 bar wedge bull flag.
However, they need 2 consecutive strong weeks up before traders will conclude that the bull trend is resuming. Without that, the odds favor more sideways to down trading. Since the January high, the weekly chart has reversed every 2 weeks. That is trading range price action and not the look of a bull or bear trend.
If the Emini does not reverse up within the next couple of weeks, it will probably have another leg down. At the moment, it does not look like it is about to reverse up. Therefore, the odds favor break below the February low. The bottom of the buy climax is the November low of 2421.75 and that is the next target on the weekly chart.
Daily S&P500 Emini futures candlestick chart:
Double bottom and wedge bottom, but too many big bear bars
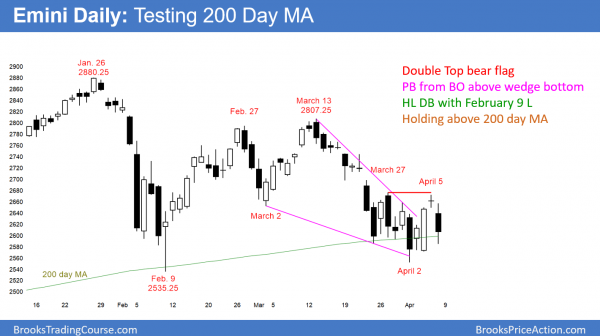
The daily S&P500 Emini futures candlestick chart is trying to reverse up from a test of the February low. This is therefore a double bottom. Furthermore, the selloff since the March 13 high is in a wedge bear channel. A bear channel is a bull flag. Finally, the bulls are trying to rally from the 200 day moving average. However, the bears want the selloff from the double top bear flag to lead to a 100 point measured move down.
The daily S&P500 Emini futures candlestick chart is struggling to reverse up from a wedge bottom and a double bottom. In addition, it is at the support of the 200 day moving average. However, the bulls need a strong breakout above the 2 week double top. If they get a strong rally above it next week, there will be a 60% chance that the low is in. That means that the Emini would then likely go sideways to up to a new high over the next several months.
The bulls see Friday as a pullback from Wednesday’s breakout above the wedge bear channel. However, Friday was a big bear day. Furthermore, there have been many big bear bars in this 10 day trading range. It is now more likely that the Emini will break below the April 2 bottom of the wedge.
Double top bear flag for a test of 2450
The Emini formed a double top with the March 27 and April 5 highs. The rally to the 2nd high in a double top bear flag is typically strong. That is the danger for the bulls. They believe that the reversal up is the start of a bull trend. Then, they are trapped into buying too high in what turns out to be a bear flag.
The bears sell aggressively and the bulls are usually stopped out below the neck line. That is the April 2 low of 2552.00. They are so surprised and disappointed that they usually will not buy again for many bars. The result is that the selloff usually has at least a couple of legs.
In addition, it typically falls for about a measured move based on the height of the bear flag. Since the 10 day range is 100 points tall, the bears want a test down to around 2450. That is also around the 20 month EMA and the bottom of the buy climax on the weekly chart. At the moment, there is at least 50% chance that the daily chart will get there within a couple of months.
The bulls are trying to create a double bottom with the February 9 low. The height to the March 13 neck line is about 250 points. In addition, the selloff from the March 13 high is a wedge. If the Emini strongly breaks below the February low, it would be a failed wedge bottom. The bears would try for a 250 point measured move target. That would be around 2300. If the Emini were to fall to that target, it would probably reverse up strongly. That would also be close to a 20% correction.
In conclusion, there is better than a 50% chance of the Emini testing below the 20 month EMA and down to the bottom of the weekly buy climax. A reasonable target is around 2450 over the next month or two.
Traders can see the end of the day bar-by-bar price action report by signing up for free at BrooksPriceAction.com. I talk about the detailed Emini price action real-time throughout the day in the BrooksPriceAction.com trading room. We offer a 2 day free trial.
When I mention time, it is USA Pacific Standard Time (the Emini day session opens at 6:30 am PST, and closes at 1:15 pm PST). You can read background information on the intraday market reports on the Intraday Market Update page.


Dear Al,
You yourself wrote that “Since the January high, the weekly chart has reversed every 2 weeks”. Then now it is turn for bulls to get their 1-2 bullish weeks in this Trading range. In addition, there are no consecutive bear bars in the last 2 weeks, they are scalping and not swinging their trades. And when looking at Daily chart there is no strong bear channel. It was but bulls corrupted it. I think that even if the bears will be stronger in the beginning of the next weak nevertheless the bulls will win the close of the weak.
Al, what do you think about Trading range continuation and next bull leg in it?
And is there any day in a weak with more chances to be bullish than bearish?
Al, sorry for arguing with you… Thank you for everything!
When the Emini is in a tight trading range for 10 days, it is telling us that neither side has an advantage. My concern is that the bull should have been able to rally last week. That was a good setup for them. Yet, the failed. That increases the odds of a bear breakout.
Also, by going sideways for 3 months, the monthly chart is now within the gravitational pull of the 20 month EMA. These 2 factors make me believe that the odds slightly favor the bears.
However, if this was clear, the breakout would be underway. Since it is not, the odds only slightly favor the bears.
I am ready to buy if the bulls get a strong reversal up. I think it is more likely that the Emini will fall below 2450 before the bulls get aggressive again. We’ll see. Anyone who has a strong opinion when the market is telling us that it has not yet decided is making a mistake. It is better to wait to see what the market decides.
Hi Al, very clear and helpful analysis, very grateful for all you do to help traders.
Dear Al,
Since I frequently trade the daily chart, I viewed the Feb. 9 low as an initial test of the 200 day MA with quick price rejection and resumption of the bull trend. But then the rally from this low was weak, forming a DT lower high and a subsequent retest of the Feb. 9 low. It seems to me that this late March, early April price action has turned into a TR with price acceptance around 2600; a potential BO in either direction appears now equally likely.
Your analysis of the bull and bear case is helpful, but how would you personally trade the current situation? Would it be reasonable to set a limit order to buy in the lower third of this 10 bar TR? Or a limit order sell in the upper third? Or would you wait for the BO?
Thank you for your insight!
I personally am looking to invest in some stocks long-term. Because I think the Emini will fall to around 2450, I am waiting for that.
As for trading the daily chart, meaning looking for 1 – 3 day trades, what you are saying is correct. My concern is that the Emini is spending too much time testing 2600. When that is the case, the odds increase that 2600 is the middle of a range and not the bottom. That means that I think we will break below for some kind of measured move down. Furthermore, there is a 50% chance of the breakout occurring in the next 2 weeks.