Market Overview: S&P 500 Emini Futures
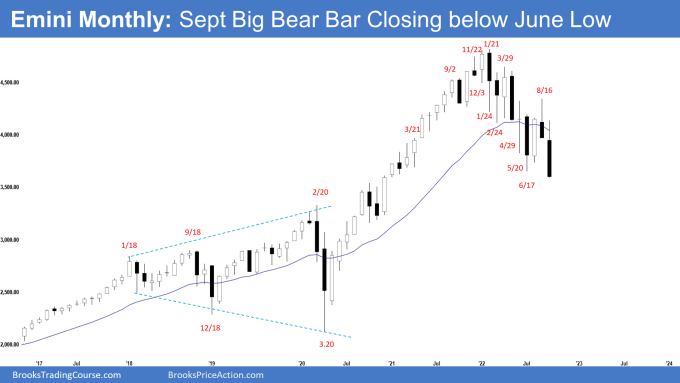
The S&P 500 Emini futures September candlestick closed below June low. The odds of an Emini third leg down of a larger wedge pattern have increased. Bulls want a reversal higher but need at least a strong reversal bar or a micro double bottom before they would be willing to buy aggressively. Odds slightly favor the Emini to trade at least slightly below Sept.
S&P500 Emini futures
The Monthly Emini chart

- The Sept monthly Emini candlestick was a big bear bar closing near the low below June low.
- Last month, we said that odds slightly favor sideways to down and if the bears get another bear bar closing near the low, the odds of the 3rd leg down of a larger wedge pattern increase.
- The bulls want a reversal higher from a lower low major trend reversal with the June low.
- They failed to create follow-through buying in August.
- They see the current move simply as a retest of the June low.
- However, because September is a big bear bar closing near the low, it is a weak buy signal bar for October.
- The bears want a 3rd leg down forming a larger wedge pattern.
- They want a continuation of the measured move down to 3450 based on the height of the 12-month trading range starting from May 2021.
- Earlier, we said that the first targets for the bears are the July inside bar low, and then a retest of the June low. They reached both in September.
- Since September was a big bear bar closing near the low, odds are October would likely trade at least slightly lower.
- The Emini may gap down at the open on Monday. Small gaps usually close early.
- There are now 2 consecutive closes below the 20-month exponential moving average, something that has not happened since February 2016.
- For now, odds slightly favor that the Emini will trade at least slightly below October low. Bears want another big bear bar closing near the low.
- Three consecutive bear bars have not happened since 2011 on the Monthly chart. It could represent a change in the character of the market.
- Bulls want October to close with a bull body even though the Emini may trade slightly lower first.
The Weekly S&P 500 Emini chart

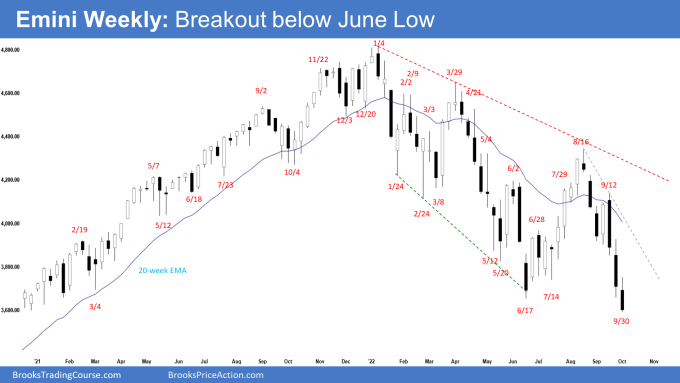
- This week’s Emini candlestick was a bear bar closing bear the low below June low.
- Last week, we said that odds slightly favor sideways to down and the June low was close enough to be a magnet below.
- The bears got follow-through selling following last week’s breakout below the OO pattern (outside-outside).
- The bears got a reversal lower from around the 20-week exponential moving average in September.
- They want a strong leg down like the one in April. The bears will need to create consecutive bear bars closing near their lows, to increase the odds of a retest of the June low. They got what they wanted.
- The selloff from August was in a tight bear channel. That means strong bears.
- The bears want a breakout and a measured move down to around 3450 based on the height of the 12-month trading range starting from May 2021.
- If the Emini trades higher, the bears want a reversal lower from a lower high around the bear trend line or the 20-week exponential moving average again.
- The bulls want a reversal higher from a double bottom major trend reversal with the June low.
- They will need to create consecutive bull bars closing near their highs to convince traders that a reversal may be underway and prevent a strong breakout below the June low.
- Because of the strong selloff, the bulls will need a strong reversal bar or at least a micro double bottom before they would be willing to buy aggressively.
- We said that the problem with the bull’s case was that the recent selloff was very strong. The sideways to up leg may only lead to a lower high.
- Since this week was a bear bar closing near the low, it is a good sell signal bar for next week.
- Next week may gap down at the open. Small gaps usually close early.
- For now, odds slightly favor sideways to down. Traders will be monitoring whether the bears get a follow-through bar following this week’s breakout below June low or if next week closes with a bull body instead.
Trading room
Traders can see the end of the day bar-by-bar price action report by signing up for free at BrooksPriceAction.com. Al talks about the detailed Emini price action real-time throughout the day in the BrooksPriceAction.com trading room. We offer a 2 day free trial.
Market analysis reports archive
You can access all weekend reports on the Market Analysis page.

