Market Overview: Weekend Market Analysis
The SP500 Emini futures traded below October low and reversed sharply higher closing above last week’s close on the weekly chart, a strong bull reversal bar. Monday is the last trading day of the month. Bulls want a strong close above the middle of the monthly candlestick around 4500. Bears want the month to close near the low to increase the odds of February trading at least slightly lower. The 4-week selloff is strong enough for traders to expect at least a small sideways to down leg after a pullback (bounce). Less likely, we will get a small pullback trend that goes all the way up to the trend extreme.
The EURUSD Forex market had a strong breakout below the 7-week tight trading range this week. The 9-week sideways to up trading relieved some of the prior oversold condition, and bears are now more confident about selling again. The bulls want the 7-week tight trading range to be the final bear flag of the bear leg. However, the bulls will need to do more by creating consecutive bull bars closing near their highs to convince traders that the breakout below the tight trading range will fail.
S&P500 Emini futures
The Monthly Emini chart
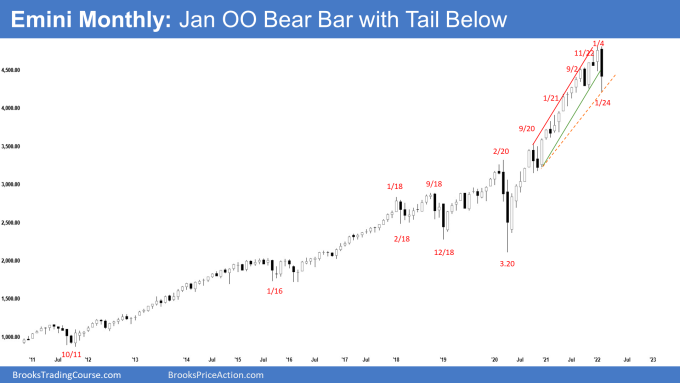
- The January monthly Emini candlestick currently is an outside down bar after an outside up December. This is an OO (outside-outside) pattern, which means Breakout Mode. January is both a buy and a sell signal bar.
- The Emini tested the bottom of the 6-month trading range but reversed back higher. There is a prominent tail below the candlestick which means the bears are not as strong as they would like to be.
- Monday is the last trading day of the month. The bulls want a close above the December low and above the middle of the month around 4510. It is attainable if they can get a strong rally on Monday.
- The bears want January to close near the low. However, the bears repeated attempts to create follow-through selling this week failed. If the Emini can’t go down, it will probably try the other direction.
- Al said that the current OO pattern follows an OO pattern in October. Consecutive attempts at a top in a buy climax have an increased chance of a reversal down. January is the sell signal bar for the OO. If February trades below the January low, it will trigger the OO sell signal.
- The bears want a breakout below January and a measured move based on the height of the OO which will take them to around 3600.
- However, if January closes above the middle of the bar and above December’s low, it will have a long tail below. That is a weak sell signal bar. Selling below a weak sell signal bar at the bottom of a 6-month trading range may be risky if more traders think the trading range is more important and would, therefore, BLSH (Buy Low Sell High).
- The bears will need February to close as another bear follow-through bar below January’s low to convince traders that a deeper correction is underway.
- The bulls see the current move as a long-overdue pullback. They want a reversal higher from a double bottom bull flag with October low and a retest of the trend extreme and a subsequent breakout to a new high.
- So, Monday is an important day as it would result in either January being a bearish bar or a neutral to a slightly bullish bar.
- Al has said that the bull trend on the monthly chart has been very strong. Therefore, even if there is a sharp selloff down to the October low in the 1st half of this year, it should be minor. Even if it sells off for a 10 to 20% correction, that would still only be a pullback on the monthly chart even though it could be a bear trend on the daily chart and not continue straight down into a bear trend.
- The best the bears will probably get on the monthly chart is a trading range for many months to around a 20% correction down to the gap on the monthly chart below April 2021 low and around the 4,000 Big Round Number
- We have said that this rally is overextended and there is a likely micro wedge forming which makes it less likely that it will continue up throughout 2022 without a pullback. January is the pullback.
- Therefore, the bull trend will probably transition into a trading range for at least a couple of months. The trading range may have already begun from July 2020.
- Al has said that the bull trend from the pandemic crash has been in a very tight bull channel. The first reversal down will probably be minor even if it lasts a few months.
- The gap up in April 2021 could lead to a measured move up to 5,801.5 before the bull trend finally ends.
The Weekly S&P500 Emini futures chart
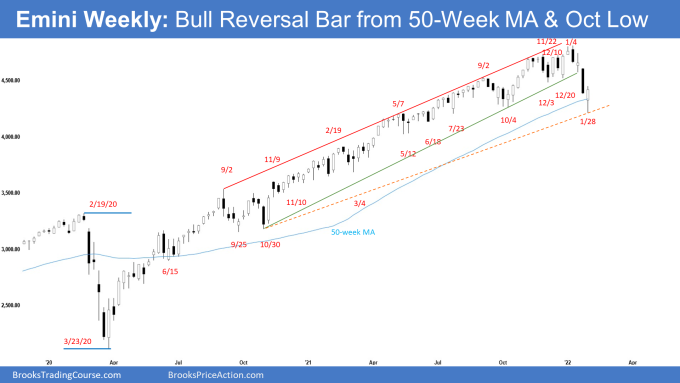
- This week’s Emini weekly candlestick was a strong bull reversal bar with a small tail above, reversing up from below October low and the 50-week MA. It closed near the high and above last week’s close.
- The bears failed to get follow-through selling following last week’s strong bear breakout.
- Since this week is a strong bull reversal bar, it is a strong buy signal bar for next week. Should the Emini trade below this week’s low, odds are there will be buyers below.
- The bears want a second leg sideways to down after any pullback (bounce) from a lower high major trend reversal. It would then be a reversal lower from head & shoulders (H&S) top where the lower high is the right shoulder.
- The bears want the pullback (bounce) to have overlapping bars with bear bars closing near the lows and weak bull bars. If they get that, the odds of a strong second leg lower increases.
- However, a H&S top often is a minor reversal pattern. The 3rd push down from the right shoulder often is the 3rd leg in what will become a wedge bull flag.
- Last week, we said that the bulls want a strong bull reversal bar even though the Emini might trade slightly lower first possibly from a double bottom bull flag with October low which is also around the 50-week moving average. They got that this week.
- The bulls see the selloff in the last 4 weeks as a bear trap and a sell vacuum test of the bottom of the 6-month trading range. Since this week closed near the high, next week may gap up at the open. Small gaps usually close early.
- The bulls want a strong follow-through bar closing near the high. If they get that, odds are the week after should trade at least slightly higher still. If the bulls get consecutive bull bars closing near their highs in the next 1 to 3 weeks, we may get another strong leg up like the one from the October 2021 low. However, keep in mind that V bottoms are rare and less likely.
- The minimum targets for the bulls are the December low or a 50% pullback of the selloff around 4510.
- The selloff in the last 4 weeks was strong enough that traders expect at least a small second leg sideways to down after a pullback (bounce). If the bulls get consecutive bull bars closing near their highs in the next 1 to 3 weeks instead, it can lead to a retest of the trend extreme.
- Al has said that the Emini has been in a strong bull trend since the pandemic crash. There have been a few times when the bears got the probability of a correction up to 50%, but never more. The probability of higher prices has been between 50 and 60% during this entire bull trend. It has never been below 50%. That continues to be true.
- The strong selloffs, like in September 2020 and again in 2021, pushed the probability for the bears up to 50%. But every prior reversal has failed, and the bears never had better than a 50% chance of a trend reversal.
- The Surprise Bear Breakout last week may have increased the odds of a correction back to 50% or just slightly more, but the bears failed to get follow-through selling below the bottom of the 6-month trading range.
- Al has said that the best the bears probably can get this year is a 20% correction down to around the 4,000 Big Round Number. This remains true.
- For now, next week should trade at least slightly higher. Whether the bulls get a strong follow-through bar next week or not will be a piece of key information.
The Daily S&P500 Emini futures chart
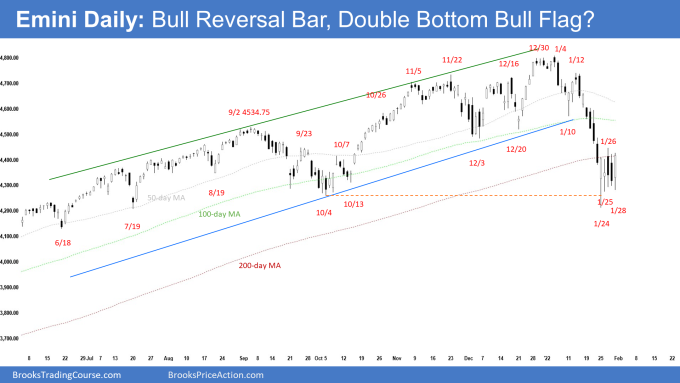
- The Emini gapped down far below the 200-day moving average on Monday and traded below October low but reversed back up to close as a strong bull reversal bar. The bulls however did not get follow-through buying on Tuesday and Wednesday. The Emini traded sideways in a tight trading range instead.
- Friday triggered the low 1 sell signal bar but reversed higher to close near the week’s high as an outside bull bar around the 200-day moving average. It is a good high 2 bull signal bar for Monday. Since Friday closed near the week’s high, next week may gap up at the open. Small gaps usually close early.
- The bulls see the recent selloff as a sell vacuum test of the trading range low which started in July 2021. As strong as the selling is, they want the selloff to simply be a bear leg in the developing 6-month trading range.
- Bulls then want a double bottom bull flag with October low and a rally to re-test the trend extreme.
- The selloff from the wedge top was stronger than all prior pullbacks since the pandemic crash. The move down from the high is in a tight bear channel which means strong selling.
- Odds favor a second leg sideways to down after any pullback (bounce), probably from a lower high around the December low and the 100-day moving average which also happens to be a 50% pullback of the selloff just above 4500.
- The bears then want a reversal from a lower high which will be the right shoulder of a H&S (head & shoulders) top. They then want a strong break below the 6-month trading range and a measured move down to around 3600 based on the height of the 6-month trading range.
- However, a H&S top is often a minor reversal pattern. The 3rd leg down from the right shoulder often is the 3rd push down in what will become a wedge bull flag.
- Less likely, the pullback (bounce) will turn into a small pullback bull trend testing the trend extreme like the one in October. However, if the bulls get a series of consecutive bull bars closing near their highs in a tight bull channel, it can change the odds in the bull’s favor.
- Al said that the entire rally from July looks like a bull leg in what will become a trading range. By trading below October low, traders concluded that the bull trend has evolved into a trading range.
- A trading range in a strong bull trend eventually turns into a bull flag instead of leading into a bear trend. The odds favor a continuation of the trend making a new high probably in the second half of the year.
- For now, there may be a bounce following recent oversold conditions. Odds favor a second leg sideways to down after the bounce is over.
EURUSD Forex market
The EURUSD weekly chart
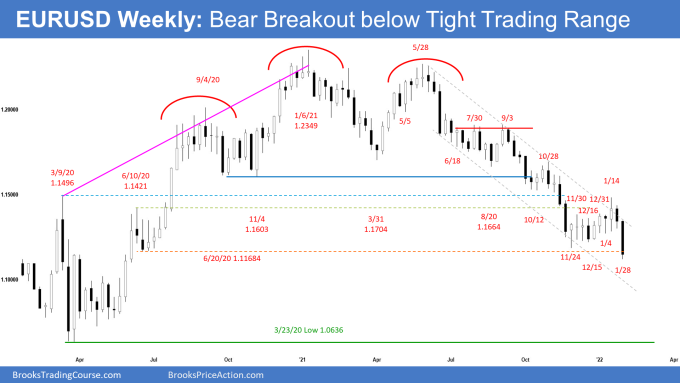
- This week’s candlestick on the weekly EURUSD Forex chart was a Big Bear Surprise breakout bar closing near its low. It closed below the lows and closes of the prior 9 candlesticks and below the June 2020 low.
- Since this week is a big bear bar closing near the low, it is a good sell signal bar for next week.
- The bears want a 200-pip measured move down based on the height of the 7-week tight trading range. They then want a continuation of the 700-pip measured move lower which started in October.
- They hope the yearlong bear trend will continue down to the 2020 low and then below the bottom of the 7-year trading range.
- If the bears get strong follow-through bear bars closing near their lows in the next 1 to 2 weeks, odds will favor a test of the 2020 low.
- We have said that a tight trading range late in a trend often is the final flag of the move. Even if there is a break below the 7-week trading range, odds are it might be the final flag of the bear leg. The EURUSD may then test below June 2020 low before there is a stronger reversal higher from a lower low major trend reversal. This remains true.
- However, the bulls will need to create bull bars closing near their highs in the next few weeks to increase the odds of a failed breakout below the tight trading range.
- The recent 2 months sideways to up trading has relieved the prior oversold conditions and bears are more confident to sell again.
- Al said that the EURUSD has been sideways for 7 years. Since trading ranges resist breaking out, it is still more likely that this selloff will reverse up for many months before breaking below the 7-year range.
- However, the more consecutive bear bars on the chart, the higher the odds will be of a successful breakout.
- Odds favor at least slightly lower prices next week.
- Bulls will need a strong bull reversal bar or at least a micro double bottom before they would be willing to buy aggressively.
The EURUSD daily chart
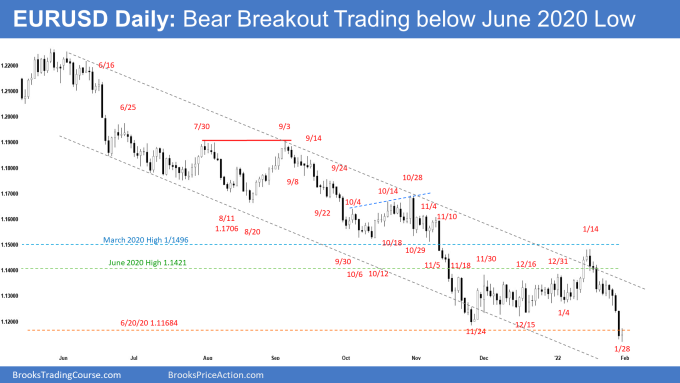
- The EURUSD traded lower from Monday to Wednesday and then had a Big Bear Surprise breakout below the 7-week tight trading range on Thursday. However, the bears did not get follow-through selling on Friday.
- The selloff from January 14 is in a tight bear channel and is strong enough for traders to expect at least a second leg sideways to down after a pullback (bounce).
- The 9-week sideways to up trading relieved some of the prior oversold condition, and bears are now more confident about selling again.
- The next target for the bears is the bottom of the yearlong bear channel, which is another 100 pips below.
- Bears then want a 200-pip measured move down based on the height of the 7-week tight trading range and then a continuation of the 700-pip measured move that started in October.
- The bulls want the 7-week tight trading range to be the final bear flag of the bear leg.
- They will need to create consecutive bull bars closing near their highs to convince traders that the recent breakout below the tight trading range will fail.
- The bears have about a 40% chance for the EURUSD to continue straight down after the recent 9-week sideways to up trading. However, if the bears continue to get consecutive bear bars closing near their lows, the odds of a test of the 2020 low will increase.
- It is still more likely that a break below the 7-week tight trading range will reverse up within a few weeks from a final bear flag. However, the bulls will need to do more by creating strong bull bars to convince traders this is the case.
- Following the Big Surprise Bear breakout, bulls will need at least a strong bull reversal bar or a micro double bottom before they will be willing to buy aggressively.
- For now, odds slightly favor sideways to down.
Trading Room
Traders can see the end of the day bar-by-bar price action report by signing up for free at BrooksPriceAction.com. I talk about the detailed Emini price action real-time throughout the day in the BrooksPriceAction.com trading room. We offer a 2 day free trial.
Weekly Reports Archive
You can access all weekly reports on the Market Analysis page.


An excellent summary, Andrew. Can you say something more about the probabilities associated with lower highs after a rallying market has seen a significant selloff? At that point, the recent trend extreme becomes a magnet and a target for the bulls. I’m always very impressed how, at that point, a market is often able to defy odds and still manage to make a new high anyway. Perhaps I shouldn’t be. Early in a bull trend, it seems easy for the market to make new high after new high, as the burgeoning trend calls attention to itself and keeps recruiting new buyers. Later in the trend it becomes more difficult as those willing to buy in at lofty levels are much scarcer. At that point, a very visible market like the S&P seems to make new highs almost into a fetish, even after the buying pressure that propelled the trend in its earlier stages is gone. This was frequently on display in recent months when, after relatively lackluster intraday trading, the bulls nevertheless pushed the index to a new all-time high at the end of the session that was soon lost again overnight or the next day. It seems as though the psychology of higher highs is very important to markets, which explains the targeting of the last trend extreme even after the market has sold off significantly. But if the market at that point is unable to attain the last trend extreme and instead makes a lower high (as occurred recently on January 12), a dynamic of lower highs (usually accompanied also by lower lows) often takes hold. This has been visible intraday recently when, after making a high overnight and sometimes also at the start of the cash session, early in the session the market then fell into a dynamic of lower highs and lower lows that often persisted until the end of the day. Now we find ourselves in a situation where a very significant selloff from the recent trend extreme has occurred and a base has formed. As you pointed out, the December lows are important resistance levels in this context. Can you say something more generally about the probabilities associated with this dynamic of lower highs after a bull trend has had a significant selloff? Bulls are hoping to regain the highs, while bears are eager to press their advantage to take the markets lower. Can you say something about how the probabilities generally work out in situations like these?
Dear John, thanks for your long comments and questions..
I just want to make sure I understand you correctly..
You want to know how to determine the probabilities of whether the retest will lead to a new high or likely to lead to a lower high and a bear breakout?
Thanks..
Basically, yes. I know you can’t foretell the future. But I was interested in what aspects of the price action in these situations you look to especially in order to judge the probabilities of the three basic scenarios that could play out: a retest of the highs and perhaps even a breakout to a new trend extreme, a trading range, or a series of lower highs and lower lows. It’s a big topic, so maybe you could just give your thoughts about the top three factors you think are most important in the current situation. Al has already covered some of this in his recent video, but I was interested particularly in how to think about the probabilities. Al frequently gives probabilities, which I assume come from his years of experience as a trader, not from some formula. I was wondering if you had any insight into this. P.S. I like the completeness and precision of the summaries you’ve been writing. Well organized and easy to follow.
Dear John, sure happy to share what I can..
For probabilities on certain situations, I learn the same from our teacher..
Next, I’ll roughly share how I would analyze whether the retest of the highs will result in:
a. new high
b. lower high and a bear trend
1) Context – the context of the overall price action is important.
Is the market in a) Trend? b) Trading range?
and within that, is the Trend strong or weak? or if Trading range, is it a broad TR or a tight TR?
If the market is in a strong trend – fairly tight channel, small pullbacks, odds are, the trend will continue after making a bull flag. In a strong trend, all reversal attempts will fail UNTIL the final one where it finally reverse the trend.
2) In analyzing the second leg re-test up, traders are looking for a few things:
1) Strength of the re-test
a. Is the re-test of the trend extreme in a tight bull channel with only strong bull bars closing near their highs?
or
b. Is the re-test weak, choppy, has a lot of bear bars closing near their lows, no bull bars, only doji bars, bars with long tails above?
If traders see A happening, bears will not want to short the strong re-test up. They will need at least a micro double top bottom, or a wedge, maybe after another reversal pattern above. It makes sense right?
But if B happens, traders see that the bulls are weak. The bars are overlapping, the bull bars are small or weak, has long tails above, and the re-test up is filled with bear bars.. If the bulls are so strong, why are there no strong bull bars? So if traders see this, odds of another strong leg down increases.
2) Again, Context
a. Is the market in a Trading range? If yes, the strong move up could be a Buy Vacuum to re-test the TR highs. If traders are sure that the market is in a TR, they will sell near the TR highs even if the leg up is strong. Traders will BLSH – Buy Low Sell High
b. If the market is in a trend, contained in a fairly tight channel with small pullbacks – a strong leg up may lead to a new high. Traders will not be too eager to short a strong leg up in this case.
This is very rough and there are many things I’m sure I have not covered.
So, the tip that I can say is, get a very strong foundation on the basics of everything Al has taught. Once you firmly know the basics, you apply it every time in every situation while studying the charts and put things in context which will makes sense to you..
Let me know if I have answered your question, and if not, list them in small chunks so it’s easier for me to address them individually..
Have a great week ahead John!
Hi Andrew,
Thank you for this very thoughtful reply. So basically you look at the bullishness or bearishness of the price action leading up to a retest of the trend extreme and use that as your guide for whether the retest will break out to a new high or fall back and turn into a bear move–whether in a trading range or as the start of a new bear trend. And I guess you use the same criteria after a selloff has stabilized and shown the potential of reversing higher in order to gauge whether the move in the direction of the recent high will even reach the trend extreme, or whether it will fall short. When it falls short and the market puts in a clear lower high, that’s never a very encouraging sign for the bulls, at least in the short run. It seems that whenever the market pauses and stops moving directionally, it’s thinking about what to do next, so you need to keep close watch at all times to see what it does and what the majority of traders will conclude from its action. As you say, context is always very important. But here I’ve noticed that it’s what traders conclude from looking at the context that really matters most. So it’s all about trying to see in the price action what other trader’s are thinking and how they’ll likely react. What you said about bears being wary of shorting when they see strong bull bars, etc, on a retest of the trend extreme is a good example of this. They see what everyone sees–the market just seems to be jumping out of its skin ready to make a breakout, so shorting is not the best idea. Of course, as you say, the best way to answer all these questions is by studying the books, videos, pattern encyclopedia, etc, that Al has provided to pass on his trading experience of over 35 years to a new generation. It’s an incredibly detailed and comprehensive presentation of the huge variety of situations that can appear in the market, and what we’ve been discussing is just one of them. Thanks again for outlining here the basic things you look to in situations like these. Have a great trading week!
Dear John, you’re most welcome..
Correct.. get a firm grounding with all of Al’s modules.. it is the ONLY thing you need to be profitable. You need not learn ANYTHING else.
However, it does not mean you will be good in 1-2 years.. it may take 5-10 years depending on individual effort..
Now and then I go back and re-read Al’s books, I’m just amazed at the detailed thinking, covering every possible variation and possible movements of every situation.. right to the smallest details.. I would bet not many humans on earth could do that. Just my honest assessment.
Alright, thanks for your comments, reach out anytime John. Have a blessed week ahead.
P/S: Experience plays an important role in your learning and application of Al’s techniques.. so.. be diligent in applying what you have learned.. The learning process will take much longer than you will expect.. mine took about 10-11 years.. and I am an extremely hard worker..
Alright, be well! – Andrew
This is the third time the S&P 500 chart has had a 5 day trading range after a pullback with a second entry long setup. It will be interesting to see if this time is like October 6th and December 6th and leads to new highs or if the bears can finally close below that October trading range.
Dear Andrew, thanks for your comments.
Yup! Can’t wait to see too.. 🙂