Market Overview: S&P 500 Emini Futures
The S&P 500 Emini futures traded higher with strong bull reversal bar closing above the 9-month trading range low (February low). The 7 consecutive bear bars were unsustainable and were a form of a sell climax.
Odds slightly favor a 2-legged sideways to up pullback beginning. However, because of the strong selling since March, traders expect at least a small second leg sideways to down after the pullback is over.
S&P500 Emini futures
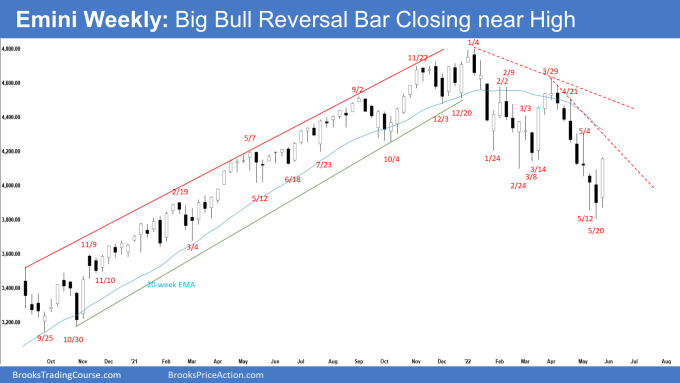
The Weekly Emini chart

- This week’s Emini candlestick was a big bull bar closing near the high and above the high of the last 2 weeks. It also closed above the 9-month trading range low (February low).
- Last week, we said that the 7 consecutive bear bars in the current leg down increased the odds that we will get a bull bar within the next 1 to 3 weeks.
- While last week was a sell signal bar, the prominent tail below makes it a weaker type. The bulls will need a strong reversal bar or a micro double bottom before they would be willing to buy aggressively.
- The bulls want a failed breakout below the 9-month trading range.
- They see a wedge bull flag (Jan 24, Feb 24, and May 20) with an embedded parabolic wedge (April 26, May 2, and May 20) and want a reversal higher from a lower low major trend reversal.
- We have said that the selloff from March 29 has been very strong. The bulls will need at least a micro double bottom or a strong reversal bar before they would be willing to buy aggressively. This week was a strong reversal bar up.
- Since this week was a big bull bar closing near the high, it is a buy signal bar for next week. Odds are the Emini should trade at least slightly higher next week.
- The bulls want a reversal back into the middle of the 9-month trading range around 4400.
- The bulls will need to create another bull follow-through bar next week to convince traders that a reversal higher may be underway.
- The bears hope that this week was simply a pullback and a test of the breakout point (February low).
- They want the Emini to stall at a lower high around Feb/March lows or around the 20-week exponential moving average or the bear trend line.
- We have said that the sell-off since March is in a tight bear channel down. Odds are the pullback would be minor and traders expect at least a small second leg sideways to down move after a pullback because V-bottoms are not common. This remains true.
- Last week, Al said that the 7th consecutive bear bar on the weekly chart was unsustainable and was a form of a climax. A 7-week streak has not happened in 21 years. Traders should expect a bounce soon and then an attempt at another low.
- Al also said that while the selloff could reach the pre-pandemic high just above 3300, which is a 38% correction, it should end before then. In January, he said the Emini should sell off in the 1st half of the year, and the selloff could be 20% and possibly reach 3700 to be followed by a rally in the 2nd half of the year. This remains true.
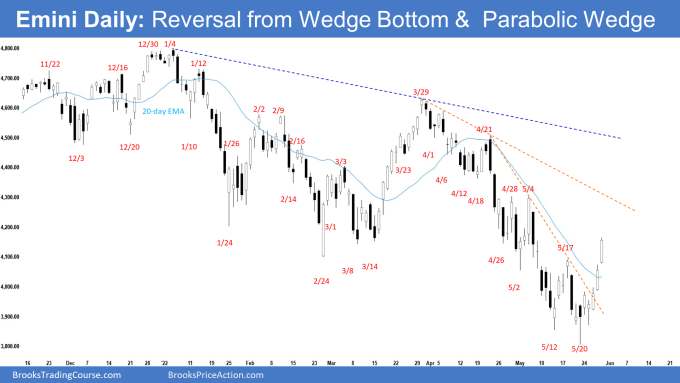
The Daily S&P 500 Emini chart

- On Monday, the Emini traded above last Friday’s reversal bar triggering the High 2 buy entry. The bears attempted reversal on Tuesday but failed and the Emini reversed higher for the rest of the week, closing above the 9-month trading range low (February low).
- Last week, we said that the bulls will need to create consecutive bull bars closing near the highs to convince traders that a 2-legged sideways to up pullback is underway.
- Otherwise, if the bounce is more sideways and stalls around the 20-day exponential moving average or May 17 high, bears will likely return to sell the double top bear flag.
- This week closed far above the 20-day exponential moving average and May 17 high. The bulls got 5 consecutive bull bars this week.
- The bulls want a reversal higher from a wedge bull flag (Jan 24, Feb 24, and May 20) with an embedded parabolic wedge (April 26, May 2, and May 12) and a lower low major trend reversal.
- They have a double bottom (May 12 and May 20) and got follow-through buying this week.
- They want the breakout below the 9-month trading range to fail and a reversal back into the middle of the trading range around 4400.
- The bears want a measured move down to around 3600 based on the height of the 9-month trading range.
- They want this pullback to be minor and stall at a lower high around Feb/March lows, or the last major lower high around 4300, or the bear trend line.
- The channel down from March 29 has been tight. Odds are, there should be at least a small second leg sideways to down after the pullback is over.
- For now, the pullback has been strong, and odds slightly favor sideways to up for the next 1- to 2-weeks.
Trading room
Traders can see the end of the day bar-by-bar price action report by signing up for free at BrooksPriceAction.com. Al talks about the detailed Emini price action real-time throughout the day in the BrooksPriceAction.com trading room. We offer a 2 day free trial.
Market analysis reports archive
You can access all weekend reports on the Market Analysis page.


Thanks Andrew for another great report! On the weekly chart if we draw a bear trend channel line (2/24)with the bear trend line(4/1 – 3/29) we will see that bears have never got a solid close below that bear trend channel line, it was a false break with prominent tails bottom and a “make sense” area for PA to reverse. In addition if we view the relationship of open/close, we will see that last week reversed the open/close of the prior 3 weeks and even bite the one prior. Re the daily chart, now that the bulls have 2 consecutive solid closes above the bear trend line as well as above 20ema, how likely are we heading to a MM based on the DB and 5/17 high?
Dear Eli, thanks for going through the report.
I’m traveling to my hometown the last couple days, sorry for the late reply.
hmm.. how likely.. that’s a good question.. I’m not used to assigning percentages.. I usually just follow what our teacher say in that regards..
I would however just monitor the buying/selling pressure daily as it develops.. as situation can change at any moment unexpectedly..
More buying pressure, higher odds.. weak buying pressure and strong bear bars then it starts to raise questions..
Hope this helps..
Have a great week ahead!
Best Regards,
Andew
Hey Andrew, is all right. Trust you have had safe trip back home. Maybe I need to better define the question: technically and PA wise and other then more bull bars, what would you like to see in order to gain confident we may head such MM target?
Dear Eli,
Thank you very much for the wishes..
Hmm.. alright I get what you are asking..
Well, it’s all the little clues.. here are some obvious ones I usually look out for:
1) pullbacks are small, shallow and sideways – means the trend is strong
2) obvious supports are holding as they are expected to – no surprise sell off
such as: ema(s), prior breakout points, prior highs/lows are holding as support as they should be
3) buying pressure is always stronger in the surges than the selling pressure during the pullback..
It’s all the standard things that Al teaches really..
I see that you are detailed oriented. I’m sure you’ll do well in catching them. 🙂
Best Regards,
Andrew
Thanks Andrew for clarifying this.
Dear Andrew, thanks again for your valuable report! I look forward to it all the time, comparing your analyses to mine ;-).
In extension to your deduction, I think it’s interesting to note that the leg 21/4 – 2/5 and 4/5 – 12/5 is an almost AB = CD distance (450 points), with 20/5 being the Failed Breakout. Similarly the Measured Move from this week should bring us to (at least) the 4400 mark, which is also where 22/4 broke strongly below the Wedge (1, 6, 18 April) and tight Trading range. It is also a gap.
My question: Could you explain to which 9 month range you refer? To my counting we are by now in a 11 month Range (if we consider the February low the bottom). By the latest May low standard, that would be then a 14-month range, right? Please let me know what I miss.
All best and have a blessed weekend!
Sybren
The trading range began last September when the very tight bull channel ended.
Thanks Andrew!
Dear Sybren, great additional observations and great attention to detail!
And Thanks to Andrew Stanton for the reply!
The trading range kept growing and growing.. and by the time the Feb lows came, it has covered more than 9-months..
For the 3600 measured move, I was using the January outside bar height..
Alright, have a blessed week ahead to both of you..
Best Regards,
Andrew
Thanks Andrew, understood by now ;-)! All best!
Sybren B
Could you please explain the annotation you are using,
“21/4 – 2/5 and 4/5 – 12/5 is an almost AB = CD distance (450 points), with 20/5”.. I am not familiar with this.
Thank you
Robert
Robert, you are right, that’s European notation. So should be “4/21 – 5/2 and 5/4 – 5/12”. Hope that makes more sense.
Thank you, understood!