Weekend report co-author Andrew A.
Market Overview: Weekend Market Analysis
The SP500 Emini futures continue to make new highs. The daily chart should break above the top of the 4-month bull channel this week, but then an Emini pullback to the middle of the channel.
The EURUSD Forex is reversing up from a double bottom with the March low. It should trade sideways to up for a couple weeks.
EURUSD Forex market
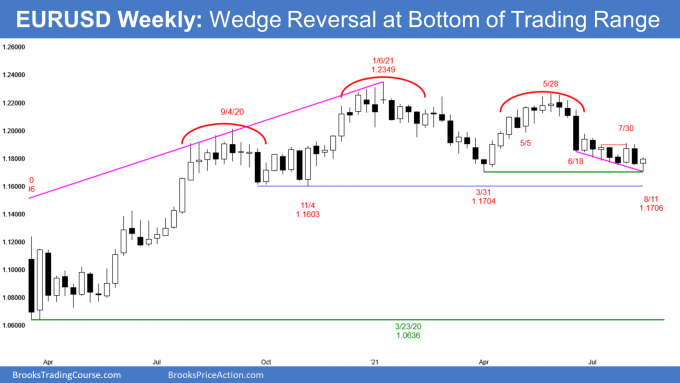
The EURUSD weekly chart

- The EURUSD Forex weekly bar traded lower but reversed from a higher low double bottom with March low.
- Bears failed to get follow-through, trapping sellers who sold below last week’s low.
- This week closed near the high and is also a High 2 bottom with the high of 3 weeks ago. It is a buy signal bar for next week.
- The EURUSD is reversing up from a micro wedge bottom over the past 10 weeks.
- Probably only minor reversal up after 10 bars with a lot of overlap. The initial target is July 30th lower high.
- If it reaches July’s high, EURUSD might then go sideways and continue the tight trading range that began in June.
- Following a break of the minor bear trendline 2 weeks ago, EURUSD could also be reversing up from a lower low Major Trend Reversal setup.
- Traders know that breakouts from trading ranges fail most of the time and price has inertia. The yearlong trading range is likely to continue.
- A small reversal bar at the bottom of a trading range can sometimes offer good trader’s equation to the bulls. In trading ranges, traders Buy Low and Sell High.
- The bulls will need signs that they are in control. These include bull bars closing near their highs, consecutive bull bars closing near their highs, big bull bars, and bars with little overlap.
- The bears want a breakout below November’s low at the bottom of the yearlong trading range, but most breakouts fail. Therefore, there are probably more buyers in this area than sellers.
- Next week should trigger the buy signal by going above this week’s high. If the bulls are in control, they should soon start to create several bull bars closing near their highs. More likely, the EURUSD will have a weak rally for a few weeks and continue the trading range that began in mid-June. Then, traders will decide between a break below the November low or a rally up to the May high.
S&P500 Emini futures
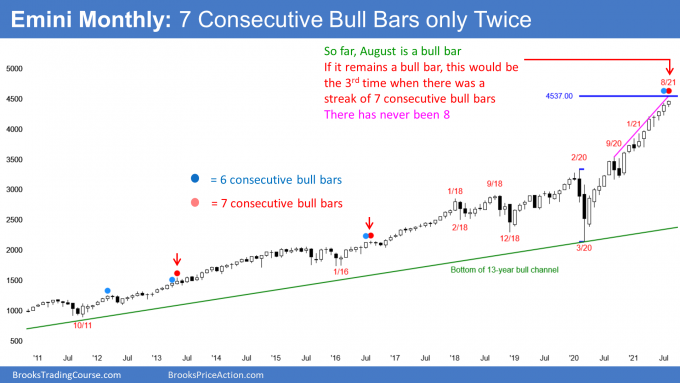
The Monthly Emini chart

- So far, August is the 7th consecutive bull bar trading, and it is at a new high.
- In the 25-year history of the Emini, there have been only 2 times when there were 7 consecutive bull bars on the monthly chart.
- If August remains a bull bar, this would be the 3rd time. There has never been a streak of 8 consecutive bull bars so August or September should be a bear bar.
- If either of them is, the yearlong rally will be a parabolic wedge. That should lead to 2 to 3 months of sideways to down trading.
- But, because the bull trend is so relentless, traders will buy the Emini pullback, even if it is 20%.
- The bears have not yet been able to create a bear bar or even a bull bar with a prominent tail on top for 6 months.
- Sometimes in a buy vacuum, sellers stop selling until the price reaches measured move or other resistance.
- The next measured move is 4537 based on the height of the pandemic crash.
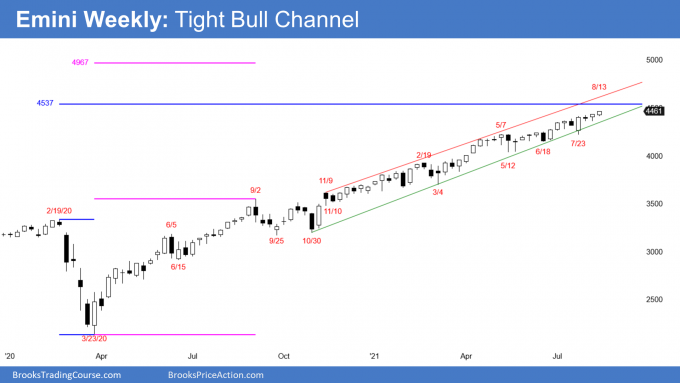
The Weekly S&P500 Emini futures chart

- The Emini weekly candlestick was a small bull bar at a new high.
- The Emini has been in a Small Pullback Bull Trend for more than 60 bars, which is unusual, and therefore unsustainable and climactic.
- A Small Pullback Bull Trend ends with a big pullback. The biggest pullback so far was the 10% selloff in September. A bigger pullback means 15 to 20%.
- The bears have not been able to create consecutive bear bars.
- There are also no prominent tails above bars. This means the bulls have been buying into closes, and they do that because they expect the next bar to be higher.
- The move up is in a tight bull channel which is also a sign of strength for the bulls.
- Until the bulls aggressively take profits, the bears will not sell. The bears need to see one or more big bear bars before they will look for a 2- to 3-month correction.
- Until then, traders will continue to bet on higher prices and that every reversal attempt will fail.
- The next targets for the bulls are the 4537 measured move (based on the height of the pandemic sell-off) and the top of the weekly trend channel line around 4600.
- The top of the weekly channel is probably too far for the Emini to get there without first having a pullback.
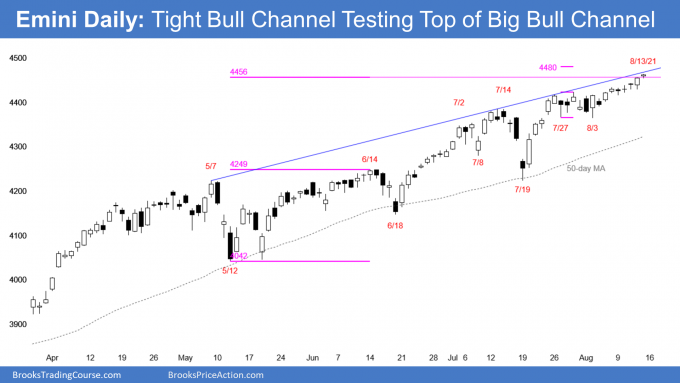
The Daily S&P500 Emini futures chart

- The Emini is in an 8-day tight bull channel, so strong rally.
- It is just above the measured move based on May/June trading range and within a few points of the top of the 4-month bull channel.
- The bull trend is strong, and therefore traders expect the Emini to break above the top of the bull channel.
- However, most breakouts fail. The Emini will probably start to reverse back down to the middle of the channel within about 5 bars after the breakout.
- If there is a pullback, traders will be monitoring if buyers return again around the 50-day simple moving average.
- While the trend has been overextended and extreme, bulls continue to bet on higher prices because they know that in a strong trend, most reversal attempts fail.
- Traders need to see aggressive profit-taking and consecutive strong bear bars before they will be willing to short aggressively. Traders will not believe a correction is underway until it is already about half over.
Trading Room
Traders can see the end of the day bar-by-bar price action report by signing up for free at BrooksPriceAction.com. I talk about the detailed Emini price action real-time throughout the day in the BrooksPriceAction.com trading room. We offer a 2 day free trial.
Weekly Reports Archive
You can access all weekly reports on the Market Analysis page.


Your analysis from monthly to daily is great and very useful.
Emini – all time frames. You’ve addressed this issue frequently to many commenters so clarification of target data is not requested. I have verified (over and over again) my set-up for charting (not trading) is identical to yours, that is, continuous contract symbol, day (U.S.) session only. I provide the context and examples that follow to ask two questions at the end, curious if you have opinions to share.
On my trading platform (thinkorswim), the Emini monthly 2/20 high is 3393.75 and the 3/20 low is 2179.50. The range between high and low, 1214.25, makes the measured move target on my platform’s monthly chart 4608, a 71 point difference from your trading platform data’s measured move of 4537.
Same inconsistent data issues on the weekly and daily. For example, high or low triggered respective buy or sell on your platform’s chart but not on my platform’s chart. Infrequent, but sometimes the bar illustration itself is not even close to identical (e.g., doji bar with tight range vs bear bar closing more than 50% below the bar’s range). Frustrating to say the least when trying to follow your charting and magnets, creating confusion.
Recognize you cannot clarify inconsistent data issues across platforms when charting parameters are identical. Two questions:
• Shouldn’t the incoming CME data feed to all trading platforms be identical? If not, that would mean an unlevel playing field for traders.
• Have you ever been suspicious of late (maybe last 5 to 10 years) of one or more trading platforms profiting from arbitrage by manipulating CME data through the trading platform’s software; the way you’ve discussed occurred frequently in the 1980s?
Thank you if you have time to provide any insight.
You can always find the correct price on the CME website:
https://www.cmegroup.com/markets/equities/sp/e-mini-sandp500.quotes.html
They own the market and can say the price is whatever they want. The most common difference is due to the broker using the front month and not continuous contracts, which I use. Another is some brokers use 24-hour data and I use the day session only, even for daily charts.
Every broker owns his own platform and he can make the price whatever he wants it to be. Many have sampled intraday data, and that increases the chance that some 5-minute bars will not be accurate.
I doubt a broker would be dumb enough to put bad data up so that he could steal from customers. People would quickly figure it out and the broker would have a major image problem.
Would the 7 consecutive monthly bull bars in 2013 also classify as a parabolic wedge top? It then failed and continued much higher.
Could the current rally do something similar?
Strong trends constantly form parabolic wedges and other reversal patterns. If the wedge has only about 10 bars, the wedge top will typically only result in a 2- to 3-bar pause in the trend and not a trend reversal.
The trend on the monthly chart began after the 2007 financial crisis, which was more than 100 bars ago. It will evolve into a trading range that will last 5 to 10 years, like in the 1970s and the early 2000’s. However, most of the attempts to end the trend will fail.
It is impossible to know in advance which top will be the one that leads to a 40% selloff over the following few years.
Because most tops fail and become bull flags, it makes sense to continue to buy every reversal until one is exceptionally big. Then, the bulls will finally sell on the next bounce, which will form some kind of double top with the earlier top. At that point, there will be a 40% chance of a bear trend. That means even once there is a clear major trend reversal starting to turn down, it is still more likely to lead to a trading range and then a resumption of the trend than to a bear trend.