Market Overview: S&P 500 Emini Futures
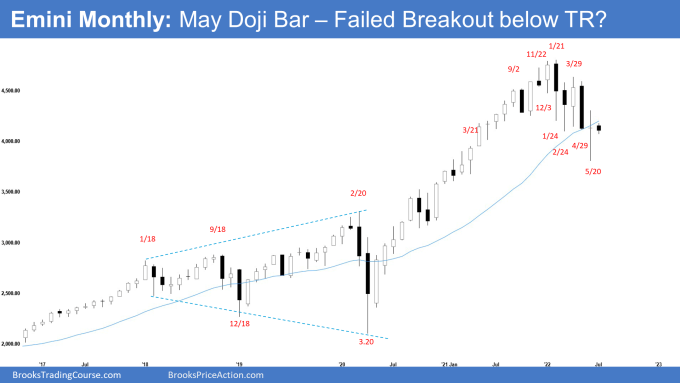
The S&P 500 Emini futures May candlestick closed as a doji bar, a possible failed breakout. The bears failed to get a follow-through bear bar. Bulls see the move down from the January high as a 2-legged pullback and a wedge bull flag (January 24, February 24 and May 20). Bulls will need to close June as a strong bull bar near the high to increase odds of a possible failed breakout below the trading range.
S&P500 Emini futures
The Monthly Emini chart

- The May monthly Emini candlestick was almost a perfect doji bar closing above the February trading range low.
- Last month, we said that odds slightly favor May to trade at least slightly lower and that traders will be monitoring whether May closes as a bear follow-through bar, or reverses up from a failed breakout below the trading range low, to close as a bull bar.
- We have said that the bears will need a bear follow-through bar in May to convince traders that a deeper sell-off may be underway.
- May broke below the 9-month trading range low but reversed up to close at the upper half of the month’s range instead. The bears failed to create bear follow-through bar.
- The bears see the move down in May as the second leg down from the January top. They want a measured move down to 3600 based on the height of the 9-month trading range height.
- Bulls want the breakout below the trading range low to fail and reverse back up. The bull’s case of a failed breakout would have been stronger if they have gotten a bull bar closing near the high.
- Nonetheless, by closing above the middle of the bar, the May candlestick slightly favor the bulls. Odds slightly favor June to trade at least slightly above May.
- They see the move from the January top as a two legged pullback and a wedge bull flag (January 24, February 24 and May 20).
- The targets for the bulls are May high and the middle of the 9-month trading range around 4400.
- We have said while the Emini may test below the 9-month trading range, breakouts from a trading range have a 50% chance of failing. This remains true.
- Earlier, Al said that the February low did not quite reach the 20-month exponential moving average (EMA). Many traders would conclude that the average was not yet tested which increased the chance of the Emini going sideways to down until there is a low at least minimally below that average. That is one of the forces behind the current selloff.
- May has adequately tested the 20-month EMA.
- Al also said that the bull trend on the monthly chart has been very strong to make a bear trend on the monthly chart unlikely. This selloff should be a minor reversal on the monthly chart, which means the selloff will probably not go much below 3800 if it gets that far.
- The Emini reversed up from around 3800 in May.
- The bears would have a better chance of a bear trend on the monthly chart after a test of the all-time high. Al has said many times that the Emini should enter a trading range for about a decade within the next few years, but picking the exact high is impossible.
- It is always better to bet on at least one more new high. The trading range will probably have at least a couple of 30 – 50% corrections, like the trading ranges in the 2000s and the 1970s.
- For now, odds slightly favor a test above May high. Traders will be monitoring whether June closes as a strong bull bar above May, or a surprise bear bar closing near the low.
The Weekly S&P 500 Emini chart

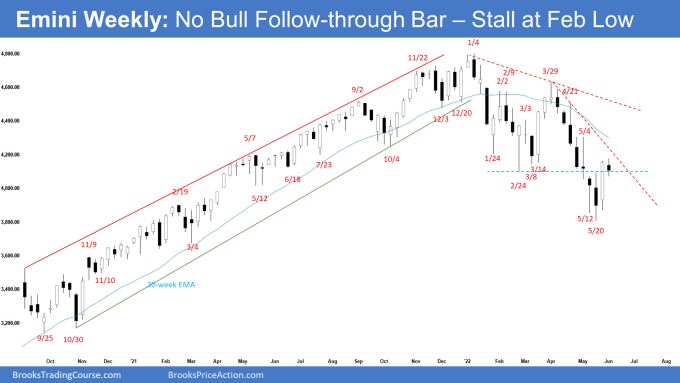
- This week’s Emini candlestick was a bear doji bar with tails above and below, closing below last week’s high but above February low.
- Last week, we said that the bulls will need to create another bull follow-through bar to convince traders that a reversal higher may be underway.
- This week was a bear doji. The bulls failed to get a follow-through bar.
- The bulls want a failed breakout below the 9-month trading range.
- They see a wedge bull flag (Jan 24, Feb 24, and May 20) with an embedded parabolic wedge (April 26, May 2, and May 20) and want a reversal higher from a lower low major trend reversal.
- We have said that the selloff from March 29 has been very strong. The bulls will need at least a micro double bottom or a strong reversal bar before they would be willing to buy aggressively. Last week was the strong reversal bar up.
- They want at least a 2-legged sideways to up pullback.
- The bears want the Emini to stall at a lower high around Feb/March lows or around the 20-week exponential moving average or the bear trend line.
- They want a re-test of May low and a continuation of the measured move down to 3600.
- We have said that the sell-off since March is in a tight bear channel down. Odds are the pullback would be minor and traders expect at least a small second leg sideways to down move after a pullback because V-bottoms are not common. This remains true.
- Al said that the 7th consecutive bear bar on the weekly chart was unsustainable and was a form of a climax. A 7-week streak has not happened in 21 years. Traders should expect a bounce soon and then an attempt at another low.
- Al also said that while the selloff could reach the pre-pandemic high just above 3300, which is a 38% correction, it should end before then. In January, he said the Emini should sell off in the 1st half of the year, and the selloff could be 20% and possibly reach 3700 to be followed by a rally in the 2nd half of the year. This remains true.
- Since this week was a bear doji with a prominent tail below, it is a weaker sell signal bar for next week.
- The bears will try to trigger the low 1 sell signal bar by trading below this week’s low.
- Traders will be monitoring whether next week closes as a bear bar near the low or reverses higher and close near the high with a long tail below.
- If next week closes as a bear bar near the low, odds of a re-test of May low increases.
- Can next week trade higher without triggering the low 1? Yes, it is possible. The Emini should still be in the 2-legged sideways to up pullback phase, with the big bull spike last week as the first leg.
Trading room
Traders can see the end of the day bar-by-bar price action report by signing up for free at BrooksPriceAction.com. Al talks about the detailed Emini price action real-time throughout the day in the BrooksPriceAction.com trading room. We offer a 2 day free trial.
Market analysis reports archive
You can access all weekend reports on the Market Analysis page.


Hello,
a simple comment. I read that we are in a possible TR for 9 months, but would it be possible to consider the start at the monthly doji candle of May 2021? Somehow , price likes that close and has paid close attention to it on several occasions in recent weeks .
Thus, the TR would already have a duration of 12 months. I suppose this would not change things much .
Thanks and regards.
P.S .: I wouldn’t want to incur spam, but being the first time I’m making a post here… and not knowing where to do it, I would like to thank Doctor Brooks for what he has done for me for almost a year in the Trading Room. And the only way I can think of is to say it in my mother tongue… “Gràcies Al!”
Dear Javier,
Thank you very much for your comments..
Yes, I do re-draw the trading ranges as it grows bigger.. in this case, the May low may yet create another bigger trading range in the future..
and if you draw the rectangle using the May low, it will cover a lot more earlier prices..
Take care and have a great week ahead!
Best Regards,
Andrew
P/S: Yes, the journey may have been long and hard, but, I owe my debt of gratitude to our dear teacher as well.. 🙂