Market Overview: Weekend Market Update
The Emini rallied strongly this week to end as an Emini outside up week. But it is still in its month-long trading range. There is still a 50% chance of a selloff to below 2700 before the Emini makes a new high.
The bond futures have been sideways for 4 months. There is no sign that the tight trading range is about to end.
The EURUSD Forex market rallied strongly in June to the bear trendline. It has stalled there and it has been in a tight trading range for a month. Because there is now an ii pattern, there will probably be a breakout up or down next week.
30 year Treasury Bond futures weekly chart:
Tight trading range after reversal down from extreme buy climax
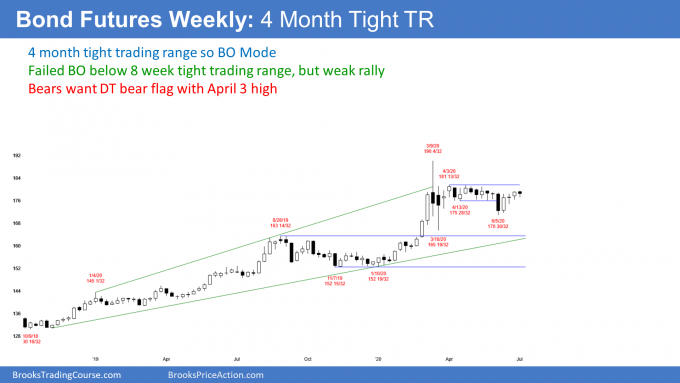
The 30 year Treasury bond futures weekly chart has been sideways for 4 months in a tight trading range. It is therefore in Breakout Mode. That means that there is an equal chance of a successful bull or bear breakout.
March reversed down strongly after the most dramatic 3 month buy climax in the history of the bond market. When that is the case, traders expect about a 10 bar sideways to down move. They look for the highest time frame that shows the pattern. Here, it is the monthly chart. Traders therefore expect the bond market to be sideways to down for about a year.
There is often one more buy climax before the pullback begins. That is what the bulls are hoping to see. But with each additional sideways month, the odds of that decrease.
Even if they were to get a breakout above the March buy climax high, it would probably fail. There would then be a 2nd reversal down. That would have a higher probability of leading to a swing down.
Target is the bottom of the last leg up
Whether or not there is a new high. traders expect the reversal down to test the bottom of the most recent buy climax. That is the January low. The bottom of the bull leg is the November 2019 low.
Since a correction from a buy climax typically lasts about 10 bars and has at least 2 legs, it could take a year or more to get there. Furthermore, there might be a bull breakout above the 4 month tight trading range before the correction begins.
As I said, the bulls might even get a brief break above the March high before the reversal begins. But if there is a break above the 4 month range, it will more likely fail and reverse down from a lower high than from a new all-time high.
What about the mantra, “Gold to infinity, interest rates to zero!”? It sounds good on TV, but that does not make it true. Nothing is going to infinity and the bond charts look like the high is already in.
EURUSD Forex weekly chart:
5 week tight trading range after strong rally to top of bear channel
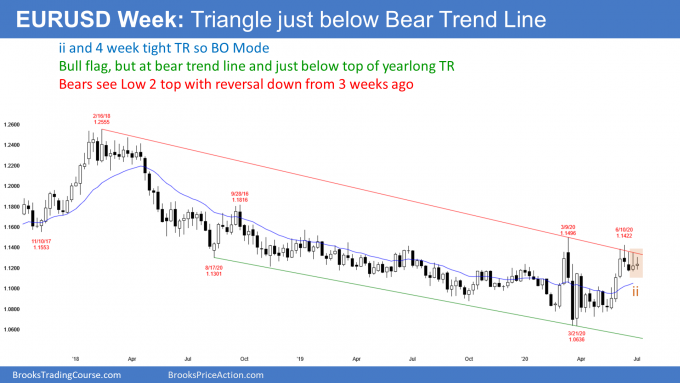
The EURUSD Forex weekly chart has been in a tight trading range for 5 weeks. This week’s low was above last week’s low. Also, its high was below last week’s high. This week was therefore an inside bar.
Last week was an inside bar as well. There are therefore consecutive inside bars on the weekly chart. That is an ii (inside-inside) pattern, which is a Breakout Mode setup.
Every 5 week tight trading range is a Breakout Mode pattern. However, the ii increases the chance that there will be a breakout next week.
With all Breakout Mode patterns, there is an equal chance for the bulls and bear. Furthermore, there is a 50% chance that the 1st breakout up or down will fail.
Given the context, do the bulls or bears have an advantage? Sometimes one side has a slight edge, but not here. The strong rally favors the bulls. But the rally has stalled at the top of a 2 year bear channel. That is good for the bears.
Does the breakout have to come next week. Not necessarily. Rarely, there is a 3rd consecutive inside bar, which then is an iii Breakout Mode pattern.
Monthly S&P500 Emini futures chart:
Shrinking bodies at top of 2 1/2 year trading range
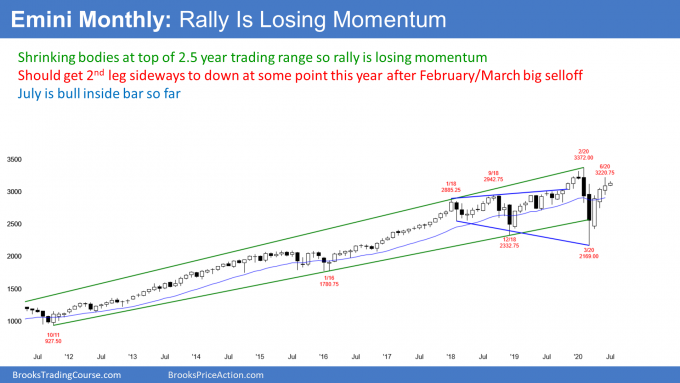
The monthly S&P500 Emini futures chart has rallied strongly for 3 months. It is now just below the all-time high.
However, it is also near the top of a 2 1/2 year trading range. Moreover, the bodies have been shrinking. That is a sign that the rally is losing momentum. The big tails in June make it almost a neutral month.
The bulls can argue that the 3 month rally is strong and therefore the Emini should go higher. But the bears see the rally losing momentum at the resistance at the top of the range.
There is still room to the resistance of the February high and the momentum continues to be up. Consequently, the bulls continue to have a 50% chance of a test of the old high within the next month or two.
If July trades below the June low, the bears will see a lower high double top with the February high. However, June had a bull body. That is a weak sell signal bar. In addition, there are 3 consecutive bull bars. That is bad context for a reversal.
Therefore, if July trades below the June low, the sell signal will be weak. The best the bears can probably get is a 1 – 2 month pullback to the middle of the 2 1/2 year trading range.
Strength usually leads to more strength
CNBC has an interesting article that compares the current market to prior markets.
The 3 month rally was exceptionally strong, up 20%.There have been 9 other times since World War II when the market rallied 15% or more in a quarter. In every instance, the market was higher at the end of the next quarter. The average gain was 9%.
Also, Ned Davis Research says on May 26, 90% of stocks in the S&P500 were above their 50 day moving averages. That has happened 19 times since 1967 and the market was up 1 year later in every instance. The average gain was 17%.
While traders don’t like to fight the tape, there are always countless variables that can affect these results. It is impossible to know if the current variables are significant enough to make traders question these statistics.
For example, how many of the quarterly rallies came from a crash, and how many ended just below the top of a trading range? If you were to only look at prior times that included these 2 additional variables, the sample size would shrink considerably. It might even become so small to eliminate the expected benefit.
There is one other historical trend that is important. When an incumbent president loses re-election, the stock market on average sells off a little in September and October. Since most pundits believe Trump will lose, that increases the chance of a pullback before November 3.
Things like this are entertaining, but not tradable. Traders trade what is in front of them, even though they might give some consideration to historical tendencies. If the market is selling off, but a study says it should be going up, smart traders will sell and ignore the research.
Weekly S&P500 Emini futures chart:
Outside up week but in 5 week tight trading range
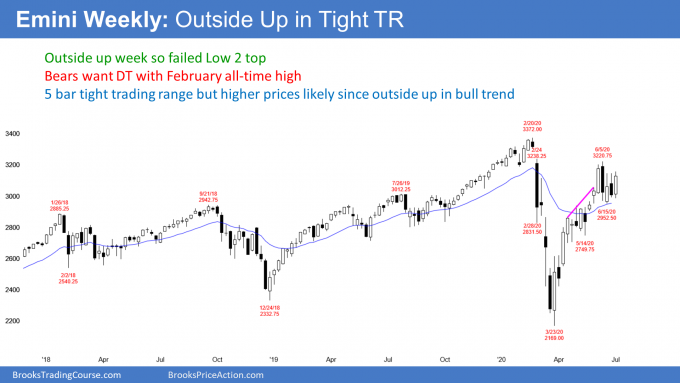
The weekly S&P500 Emini futures chart formed an outside up bar this week. The week traded below last week’s low and then above its high. This is a sign of strong bulls, especially when it is in a strong bull trend.
However, the week did not close above last week’s high. Therefore, the bulls were not as strong as they could have been. Traders would have seen the week as much more bullish if the week closed on its high and far above last week’s high.
Last week was a bear bar and a sell signal bar for a Low 2 top. When this week traded below last week’s low, this week triggered the sell signal.
But there were more traders looking to buy the sell signal than willing to sell it. The Emini immediately reversed up and rallied strongly all week.
Tight trading range so expect reversals
It is especially relevant that the weekly chart has been sideways for 5 weeks. When you look at the 5 candlesticks, you should notice something. Each week was a strong candlestick that was in the opposite direction of the prior week (bull, bear, bull, bear, bull). Therefore a big trend bar is not as meaningful as a similar bar that is not within a tight trading range.
Don’t get too excited with there is a big trend bar in a tight trading range. It has less predictive power than what you might think. Until there is a breakout, there is no breakout.
The importance of the big gap down in February
A failed sell signal in a strong bull trend typically means that the market has to go higher to find more sellers. I have talked about the gap about the February 24 high many times. Gaps on the weekly chart are rare. That gap was huge and it was the start of the pandemic crash. It therefore is important and a strong magnet.
I have been saying the the biggest problem with any reversal down over the past month is that many traders are unwilling to sell until after they see a test into that gap. Alternatively, they will sell if there is a strong reversal down. If the Emini trades into the gap, traders will then wonder if the rally will make a new all-time high.
There is currently a 50% chance that the rally will enter the gap before reversing down to the middle of the 2 1/2 year trading range. If it does, there will be a 50% chance of a new all-time high before a reversal down.
What about the bears?
There is always a bear case. The Emini has been in a trading range for 2 1/2 years. That means that reversals are more likely than a successful breakout. Remember, the February high led to a reversal down from above the range. Also, the March low reversed up from the below the bottom of the range. When any market is within a trading, nothing is as bullish or bearish as it might appear.
The bears had a good chance of beginning a reversal down this week, but they failed. They will try again over the next few weeks. For example, if the Emini enters the gap, the bears will try to have the breakout above the February 24 high fail. If they can create a big bear bar closing near its low, traders will look to sell a reversal down from the gap.
They can even create a sell signal next week. If next week goes above this week’s high, but reverses down and closes on its low, traders will again look to sell.
Alternatively, what happens if next week fails to break above this week’s high? Suppose that this week is a bear inside bar closing on its low. There would then be an ioi (inside-outside-inside) Breakout Mode pattern. If the bar closed near its low, it would be a credible sell signal bar. Traders would be prepared for a reversal down.
The Fed is promising protection
I have said many times that the Fed strongly made the point that they will “print infinite money” to protect the economy. Nothing else matters. Bad earnings, high unemployment, reduced consumer spending, the possibility of Biden winning, the possibility of Trump winning, the chance that the democrats will win the Senate… who cares? Investors believe that the Fed will buy anything, including ETFs, to prevent a dangerous selloff. Therefore, the Fed is essentially providing a put for anyone who owns stock. They are promising that the downside is not dangerous.
It is important to note that they allowed a 35% selloff in March. I suspect that they will allow a 50% pullback at some point within the next couple years. But traders believe that the Fed will buy aggressively at some unknown level. Therefore, if a trader buys at the high and the market falls 50%, they can buy more, expecting a big enough Fed bounce to allow them to exit their position at their average entry price and avoid a loss.
Investors think they are trading risk free so why not buy, even at the high? Either the Emini continues up and you make a profit. Or, it goes down, you buy more, and then make a profit.
But complacency can be expensive. Many traders think they will buy more if the Emini drops 20%. But when it actually does, they might get scared and instead exit with a huge loss.
How low can the Emini go?
Given that the Fed has guaranteed that it will protect the economy, traders are confident that the protection will include the stock market.
However, the Fed will not bother to stop a 2% selloff. What about a 15% selloff? No one knows when they will come in. There are many factors involved, including the rate of the selloff and the reason behind it.
Also, there is the extra protection that comes ahead of the election. The Fed does not want to do anything that will make traders believe they are trying to influence the election in either direction. That means their best course is to keep their promise that they will protect the economy.
This significantly reduces the chance of another crash ahead of the election. This is true even though there are sometimes big selloffs in the August through October window.
However, the Emini has been in a trading range for 2 1/2. Experienced traders expect occasional pullbacks to the middle of the range. That middle is around 2700, which would be about a 15% correction. It could be a little more or less, but the 2600 – 2700 area is probably the lowest the Emini can go until after the election.
Daily S&P500 Emini futures chart:
Double top bear flag but still in month-long tight trading range
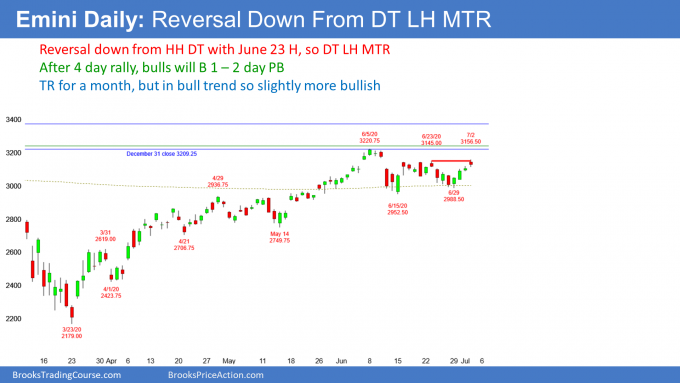
The daily S&P500 Emini futures chart has been sideways for a month. However, this week’s reversal up was strong. It came from a higher low, and there was both a strong buy signal bar and a strong entry bar. The reversal up was enough to make traders believe that the Emini will break above the trading range next week.
The next target is the June high and then the gap above the February 24 high (seen on the weekly chart). If the bulls can get a strong rally up to the gap, the rally will probably continue to a new high.
As long as the Emini is in its month-long range, the probability of either a bull or bear breakout cannot be more than 55%. And that probability changes with each day’s price action. It is currently slightly more bullish, but a couple down days will shift the odds in favor of the bears again. Traders believe that there is about a 50% chance of a selloff to 2700 before there is a new high.
Can the Emini reverse down from here?
It is important to note that while Thursday broke above the June 23 top of the range, it did not break far above. Also, it did not close above the trading range. Consequently, the bears still have almost a 50% chance of getting a reversal down from a double top with the June 23 high.
This is a double top lower high major trend reversal (the 2nd high in the double top is slightly higher). A major trend reversal has a 40% chance of leading to an actual reversal of the trend and not just a small leg down (a minor reversal).
Thursday is a sell signal bar. But, there was a prominent tail below the bar. Also, the bear body was small and it followed a strong 3 day rally. Consequently, if Monday falls below Thursday’s low to trigger the double top sell signal, the selloff will probably only last a day or two.
The bulls would likely try at least once more to break above the top of the month-long range. Therefore, a selloff on Monday will more likely be a pullback from this week’s rally than a trend reversal down from the double top.
But, if the reversal down comes from a big bear bar or 2 or 3 smaller bear bars, the probability will again favor the bears. Because the Emini has been in a trading range for 2 1/2, traders expect a pullback to the middle of the range at some point.
It can begin at any time. And that includes from above the all-time high. There are often brief breakouts of a range before there is a reversal.
It is important to remember that surprisingly strong selloffs tend to occur in August through October. I have talked many times about the magnets below between 2600 – 2700. If the Emini breaks strongly below the June low, it will probably reach those targets before testing the all-time high.
The market does not believe that Biden is going to be an economic disaster
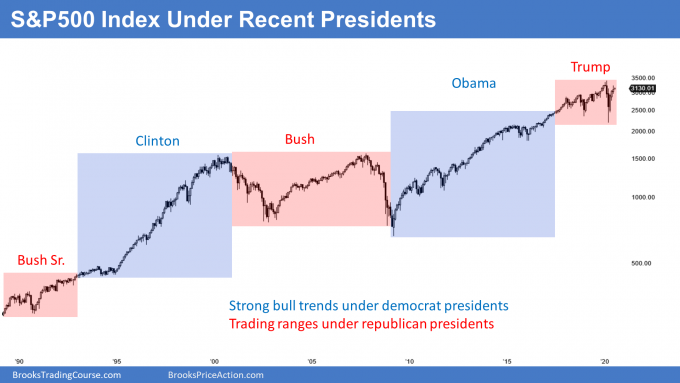
Most people at this point believe Biden is going to win in November. That is already factored into the current price. Therefore, smart money does not see him as a disaster. If it did, the market would already be way down.
It is a mistake to believe that the stock market does worse when democrats are president. In fact, the data shows the opposite. The average gain under democrat presidents is greater than under republican presidents. This chart shows the S&P500 cash index under the 5 most recent presidents.
The lesson is that the market and the economy is too big and powerful for a president to have much influence. Yes, taxes are higher when a democrat is president, but there are countless other ways that a president can influence the market, and there are many other variables as well.
When you factor everything in, there is probably no significant difference. This is true even though the data shows that the market does better under democrats. I think the sample size is too small to draw a conclusion other than it does not clearly matter.
Incidentally, this presupposes that Trump will be the candidate. I have been telling my friends for several weeks that I am not convinced he will continue to run. He hates to lose, and he might conclude at some point that the loss could be big enough to damage his brand. Dropping out has to be a consideration.
Traders might be waiting for a vaccine
Many traders are hesitant to buy up here until there is a vaccine. They know that it is possible that there will not be a vaccine, or at least not until late in 2021.
Everyone expects one early in 2021 and they will be disappointed if it is not ready. Their fear is that it will never be ready. The market is at a price consistent with a vaccine coming out in about 6 months. If there is not going to be a vaccine, that would be horrible for the economy and therefore the stock market would reprice to a much lower level.
Traders knows that an approved vaccine is worthy of a special rally. That special rally might be a new all-time high. I believe there is an unspoken belief that the Emini will not make a new high until after there is a vaccine.
If enough traders come to believe that, the market will sense a lack of buying at the current price. It would then have to fall to find buyers. For example, it could reach my target zone below 2700 within a few months. Then, at the end of the year, if a vaccine got approved, the Emini could rally to a new high.
Trading Room
Traders can see the end of the day bar-by-bar price action report by signing up for free at BrooksPriceAction.com. I talk about the detailed Emini price action real-time throughout the day in the BrooksPriceAction.com trading room. We offer a 2 day free trial.
Charts use Pacific Standard Time
When I mention time, it is USA Pacific Standard Time (the Emini day session opens at 6:30 am PST, and closes at 1:15 pm PST). You can read background information on the intraday market reports on the Market Update page.


Hi Al. What do you think is the chance of Biden, or a democratic congress introducing a financial tax transaction practically ending daytrading as we do it now. What will be the solution in that case? Forex? CFDs outside of US?
0%.
One of the reasons why President Trump might not be reelected is that he chose to ignore the advice of medical experts on a medical problem that affects the entire country.
Day trading is critical for the economy in many ways. It makes the U.S. markets the most efficient and liquid in the world.
Get rid of the liquidity, then no longer great markets. You are I are insignificant, but high frequency trading firms create maybe 70% of the volume, and their day trading is critical.
There will always be fringe elements who grandstand for their base and get TV time by threatening a revolution. But America has already had its revolution. Since then, all that we want is evolution.
Virtually no politician would make a decision on a issue that affects the entire country without following the advice from experts in the field. That is political suicide. 0% chance of the democrats being that stupid.
Good Morning. Excuse me, but in place of “The big tails in July make it almost a neutral month.”, Wouldn’t it be “The big tails in June make it almost a neutral month.”? I am sorry for the inconvenience and I am very grateful for all the help!
Thanks Magnus. Yes, you are right. A typo. No need to say sorry! 🙂 I have fixed it for Al.
the “index under recent presidents” chart is not correct. Trump was elected in 2016 and the chart indicates in 2018.
It’s possible the chart uses the time period the president is in office and able to enact his agenda which doesn’t start on election, or even, inauguration day.
You are right. He became president on January 21, 2017. I just adjusted the box a little to the left. The March 2020 low was still below when he became president.
To be fair, markets trade on perception: The “Trump” effect took place the day after election day when the markets initially sold off (due to the surprise) then reversed. The S&P rallied from there, not because Obama was still in office as a lame duck, but because it knew Trump’s deregulations and business friendly policies would benefit businesses and jobs.
There are so many variables that what most analysts do is simply use the day the president took office.
The democrats can argue that the market went up during Trump’s 1st year because the momentum of the Obama bull trend was so strong that it continued for Trump’s first year. Trump rode Obama’s coattails. Then, the democrats can further argue that market became disappointed by Trump’s lack of achievements, resulting in the death of the strong bull trend Trump inherited and its conversion into a 3 year trading range.
Trump’s camp can argue that the market has not gone anywhere for 3 years because the do-nothing democrat Congress has prevented Trump from doing the things necessary to unleash the full potential of the economy.
It’s all political sophistry during an election year. Lots of emotion, everything is true, everything is false, but the actual facts are unknowable. People pick the ones that make them feel good.
I prefer to be stupid and just use the inauguration date, and I trade what is on the charts. If the market is going up, I buy. If it is sideways, I buy low and sell high.
Great report Al. In your 2020 yearly outlook you spoke of roughly 10 years of sideways trading action, if prices did break out to a new all time high then how much higher do you think they could realistically go? I can’t imagine too much higher from there if you feel it will be sideways (with big swings) for a while. Thanks!
I have talked about this a few times. It probably can go near 4,000, but if it goes above 4,000, then the trading range idea would be wrong.
However, the current trading range would probably be the Final Bull Flag, and I would look for a reversal down to around 2000 instead of to 1800.
Hi Al,
I was wondering how you generally make your percentage predictions.
Is it solely based on your price action intuition and years of study?
Sincere thanks for everything you do.
I spent about 10,000 hours testing lots of ideas many years ago. That is the basis for much of it. Then, more than 3 decades doing this has made me very comfortable with coming up with percentages.
Some ideas are pretty simple and a beginner can quickly see they are right. For example, in a trading range, the probability of a bull or bear breakout cannot be more than 55%. If something is 60%, that is a strong consensus and there is no confusion. If a person senses confusion, the probability cannot be 60% and the market must be in a trading range.
Thanks for the detailed report Al, have a good weekend ahead.