Weekend report co-author Andrew A.
Market Overview: Weekend Market Analysis
The SP500 Emini futures is reversing lower from a higher high major trend reversal at a measured move based on the pandemic crash. There is also an expanding triangle and a trend channel line overshoot. September or October should be the high of the year and the start of a 15 – 20% correction. There is a 40% chance that it is underway.
The EURUSD Forex is pulling back from the top of its 3-month trading range. The bears are looking for a resumption of the bear trend to below the November 2020’s low. However, after 2 strong bull bars and a wedge bottom, it is more likely that there will be a 2nd leg sideways to up.
EURUSD Forex market
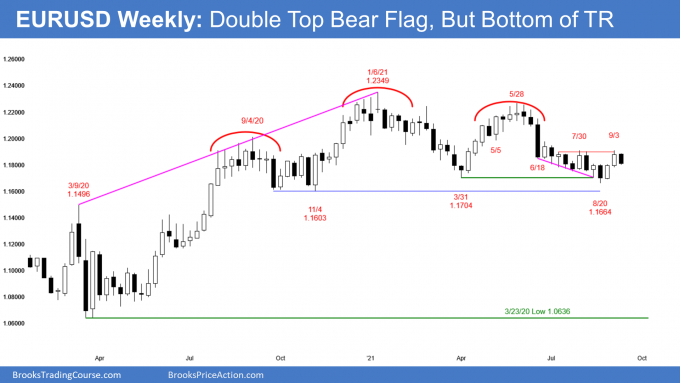
The EURUSD weekly chart

- This week’s candlestick on the weekly EURUSD Forex chart was a bear inside bar closing near the low.
- The yearlong trading range is both a head and shoulder top and a bull flag. Traders are deciding on the direction of the ultimate breakout.
- There is no evidence that the breakout is about to begin. Traders are looking for reversals ever week or two.
- Bears want the July 30/September 3 double top bear flag to lead to a resumption of the bear trend to below the November 2020 low, followed by a 700-pip measured move down.
- After 2 consecutive strong bull bars and a reversal up from the bear channel and March low, the odds favor at least a small 2nd leg sideways to up from above the August low.
- The bulls want a break above the June 25 high and then a measured move up to the January high. That is the top of the yearlong trading range.
- Most breakouts from trading ranges fail. Markets have inertia and tend to continue what they have been doing.
- Therefore, the yearlong trading range is likely to continue. That means there should be a rally for a couple of months beginning, but there might first be a brief break below the August or November low.
S&P500 Emini futures
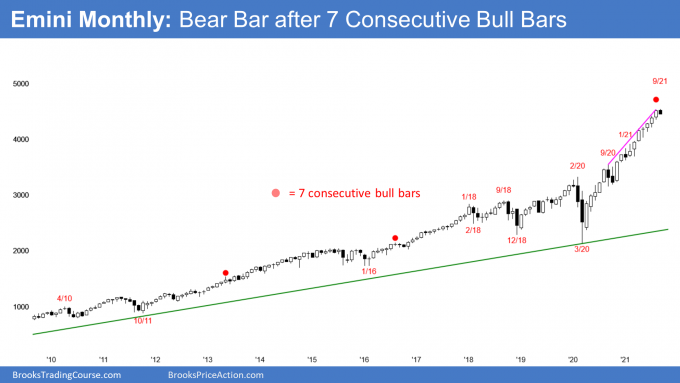
The Monthly Emini chart

- The candlestick on the monthly Emini chart so far is a small bear bar closing near its low.
- August was the 3rd time in the 25-year history of the Emini when there was a streak of 7 consecutive bull bars. On the monthly chart of the S&P500 cash index, there has only been 6 times in over 60 years when there was a streak of 8 bull bars. There has not been a streak of 9 bars in that time. September or October should be a bear bar.
- If September or October is a bear bar, it should lead to a 2- to 3-month correction of 15 to 20%.
- The odds of a correction increase if the bear bar has a big bear body and closes near the low.
- While the current candlestick is a bear bar, it is still early in the month and the appearance of the bar can be different by the end of the month. This is especially true with the September 22 FOMC being a potential catalyst for a big move in either direction.
- Will this month turn into a bigger bear bar? For example, will it trade below the August low and become an outside down bar? Or will the bulls buy the dip again, creating a tail below the bar and another bull bar?
- The bears have not yet been able to create a bear bar or even a bull bar with a prominent tail on top for 7 months. This is a sign of eager and relentless buying.
- The move-up is in a tight bull channel, and September is following a 7-bar bull micro-channel. Because of this, traders will buy the first pullback, even if it lasts a few months and falls more than 20%.
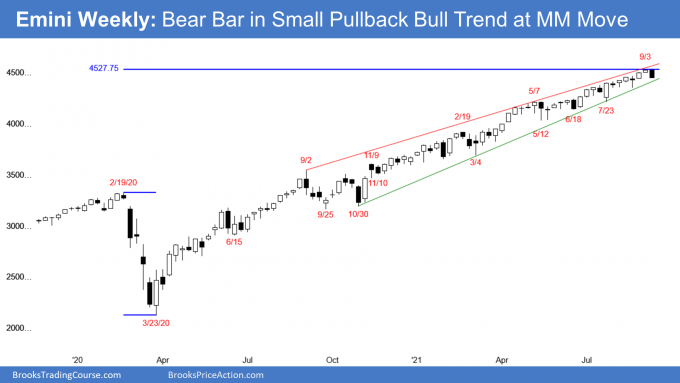
The Weekly S&P500 Emini futures chart

- This week’s Emini candlestick was a bear bar reversing down from the top of the wedge bull channel and the measured move target based on the pandemic crash.
- Because the Emini closed near the low of the week, next week could gap down, creating a gap on the weekly chart.
- Bears need to break the trend line strongly around the 4410 area to convince other traders that a correction may be underway.
- Next week is the follow-through bar. If it is a big bear bar that closes near its low, a 2-legged sideways to down correction of at least 15% will probably be underway. Traders will see it as a sign that the bulls are starting to take profits aggressively.
- The bulls want next week to be a bull bar closing near its high. If it is, there will probably be another new high before the correction begins.
- The Emini has been in a Small Pullback Bull Trend for more than 60 bars, which is unusual, and therefore unsustainable and climactic.
- The 2 common ways for a tight bull channel to end are either with a break below the bull trend line (bottom of the channel) or a failed breakout above the channel.
- Traders will conclude that the Small Pullback Bull Trend has ended once there is a big pullback. The biggest pullback so far was the 10% selloff in September 2020. A bigger pullback means 15 to 20%.
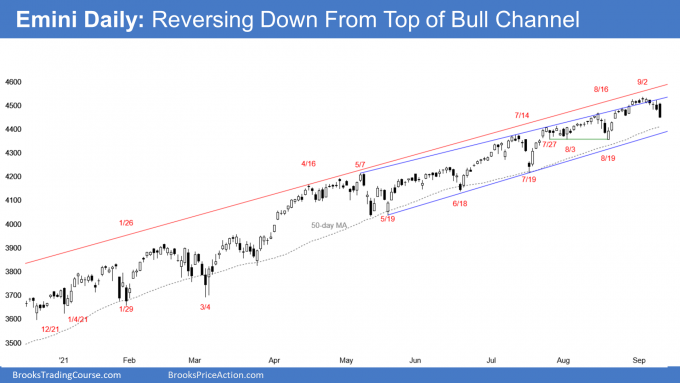
The Daily S&P500 Emini futures chart

- The Emini traded back into the channel after 5 bars above the channel.
- The bull trend has been very strong, overextended, and extreme, but traders know that most reversal attempts in a strong trend fail.
- There have been many reversals attempts on the daily chart over the past year and a half. Traders bought every one, correctly betting against a successful reversal.
- There are currently several things that increase the chance of a correction this time.
- The most important one is the monthly chart. It should have at least a couple consecutive bear bars beginning in September or October, which would mean at least a 10% correction on the daily chart.
- The weekly Small Pullback Bull Trend should soon have at least a 15% correction.
- The daily chart has been reversing down for 5 days after 5 days above the bull channel.
- The rally ended just slightly above the measured move from the pandemic crash, which is important resistance.
- There is a higher high major trend reversal and an expanding triangle (it began with the July 26 high).
- The past 2 days were big bear bars.
- All of these factors mean there is currently a 40% chance that this week’s selloff is the start of the 15 to 20% correction.
- If there are additional big bear days over the next week, the odds that this is the start of the correction will increase.
- The first target for the bears following a failed trend channel line overshoot is a test below the bull trend line, which is around the 4380 area.
- The reversal typically tests also the most recent low, which is the August 19 low.
- The 50-day simple moving average currently around the 4420 area has been a constant support for the past year at least.
- If the bears get consecutive bear bars closing on their lows and below these support levels, traders will conclude that the correction is underway.
- A correction typically has to be about half over by the time traders believe it is taking place.
- Until then, traders will continue to buy every reversal down, including this one, betting on another new high.
Trading Room
Traders can see the end of the day bar-by-bar price action report by signing up for free at BrooksPriceAction.com. I talk about the detailed Emini price action real-time throughout the day in the BrooksPriceAction.com trading room. We offer a 2 day free trial.
Weekly Reports Archive
You can access all weekly reports on the Market Analysis page.


Hi, Al
I noticed you stopped updating your scenario for the bond market and I miss your updates a lot. Would you be so kind to bring it back it if it’s not too much to ask? I wonder if you could update it once a month or every once in a while since it’s one of the most important markets for the whole economy.
Thanks for everything
Option traders are clearly expecting volatility next week. The expected move priced into the SPX options for last week was 50 points. The expected move on Friday for next week is 115 points.
Interesting. Do you think the ‘expected moves’ numbers can assist daytraders, perhaps in setting profit targets etc.
Just hoping to get a clarification. I read somewhere that SP had a run of 10 monthly bars (without a bear bar, may be the answer),in 2017. It is also possible that this may be the cashindex. I am for sure convinced that you are right. Just wondering if it is possible for you to clearify why someone claimed this?.
Hi Erik, good day to you.. I think the other person may be looking at 24 hour data, while Al is looking at Cash hours only..
I showed a chart of the monthly chart of the cash index and the Emini last week. The biggest streak in the cash index was 8 bull bars. That is not the same as a streak of up months. A month can gap up and close above last month’s close, yet have a bear body.