- Market Overview: Weekend Market Analysis
- 30-year Treasury Bond futures
- Bond futures weekly chart reversing up from bottom of 8-month trading range
- EURUSD Forex market
- EURUSD weekly chart formed an bull inside bar and High 1 buy signal bar, but at top of 9-week tight trading range
- S&P500 Emini futures
- A stock market fairy tale about a lame, but very strong duck
- Monthly Emini chart has big bull bar in November, but rally is stalling at September high
- Weekly S&P500 Emini futures chart has bear inside bar after last week’s breakout above a 3-month trading range
- Daily S&P500 Emini futures chart stalling at September high
Market Overview: Weekend Market Analysis
The SP500 Emini futures market is stalling at the September high. There are bear inside bar sell signals on the daily and weekly charts.
Bond futures are trying to reverse up from a double bottom on the weekly chart. But because the bear channel has been tight, a trading range is more likely than a bull trend.
The EURUSD Forex weekly chart formed a bull inside bar this week. This is a High 1 bull flag buy signal bar, but it is at the top of a 9-week tight trading range. Traders are deciding if the summer rally is resuming or if there will be a 2nd leg down from the 4-month wedge top.
30-year Treasury Bond futures
Bond futures weekly chart reversing up from bottom of 8-month trading range
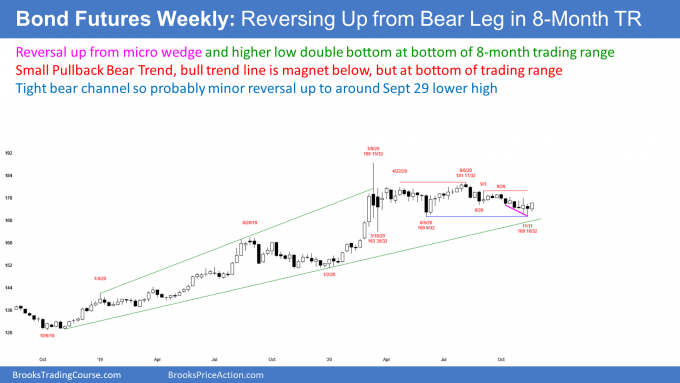
The weekly bond futures market reversed up last week from a lower low double bottom with the June 5 low, which is the bottom of the 8-month trading range. But because last week’s reversal bar had a bear body, it is not a strong buy signal bar. However, this week had a bull body and it closed near the high of the week.
There is now a 2-bar reversal with the 2nd week being a bull bar closing near its high. This is a higher probability buy setup. Traders expect the bond futures next week to go above this week’s high. That would trigger the buy signal.
Since it is taking place at the bottom of a trading range, the bond futures should rally for at least a week. Can the rally reach the top of the 8-month range? Probably not without one or more pullbacks along the way.
This week is also a Low 1 sell signal bar for the 4-month bear trend that began on August 6. But it is a bull bar and it is at the bottom of a trading range. That make this a low probability sell signal. There probably are more buyers than sellers below this week’s low.
Spike and Channel Bear Trend
The selloff from the August high was a bear Spike and Channel pattern. The top of the 1st pullback after the August 13 spike down was the start of the channel. That is the September 3 or September 29 high, above 177. When a spike and channel pattern reverses up, the rally typically reaches around the start of the channel. The chart then usually evolves into a trading range.
At the moment, I think the bond futures might not get that high. A more important target is the November 5 high. That was the start of a sharp reversal down from a huge bull day on November 4.
Pullback to below bottom of bull trend
While last week’s low fell below the low of that big bull bar, the selloff still can be viewed as a deep pullback from that big bull bar. Sometimes a pullback early in a bull trend will drop below the start of the bull trend, and then the market reverses up again.
If there is a 2nd reversal, like on November 11, technicians will say that the 1st reversal up failed and this is now a 2nd reversal up. While I think this is correct in a strict sense, it is not that simple. The forces at play are consistent with the new low being simply a deep pullback from the strong reversal up on November 4. It was so deep that it actually pulled back below the bottom of the big bull bar.
So, who is right, me or the rest of the world? I would not be bringing this up if I did not think I was right. The more open a trader is to different ideas, the more trades he will find and the more confident he will be when he manages his trades. Therefore, it is reasonable to view the November 11 new low as simply a pullback that was surprisingly big, so big that it dipped below the bottom of the bull trend.
EURUSD Forex market
EURUSD weekly chart formed an bull inside bar and High 1 buy signal bar, but at top of 9-week tight trading range
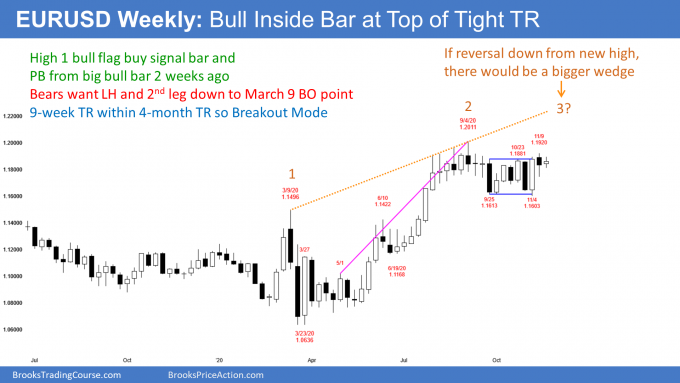
The EURUSD Forex weekly chart formed a small sideways week this week. Its low was above last week’s low and its high was below last week’s high. This week was therefore an inside bar, which is a sign of neutrality.
It is a type of Breakout Mode pattern. The bulls see it as a buy signal bar for a pullback from the strong rally 2 weeks ago. For the bears, it is a sell signal bar. They see the 2-week rally as a pullback from the September 25 1st leg down. The bears want a 2nd leg down from the 4-month wedge top.
Who is right? Both are! Which is more likely, a continuation up from the 2-week rally or a reversal down? A Breakout Mode pattern is usually very close to a 50-50 pattern. The bull body and the big bull bar 2 weeks ago, make a bull breakout slightly more likely. But whether there is a bull or bear breakout, next week will probably not be a big trend bar.
Also, with the weekly chart being in a tight trading range for 9 weeks, traders expect more reversals. Consequently, this Breakout Mode pattern will probably not immediately lead to a trend. There probably will be sellers not far above and buyers not far below. This should lead to at least another week or two of quiet trading, as traders continue to decide on the direction of the next move.
All Breakout Mode patterns eventually break out
There will eventually be a trend again. But betting that any one week will be the start is a low probability bet. If the bulls get a couple consecutive big bull bars, traders will conclude that the correction from the 4-month wedge buy climax has ended. They will look for a new high and a rally up to the February 2018 high at around 1.25.
If the bears instead get consecutive big bear bars, they will look for a deeper correction from the 4-month wedge top. Their 1st target is the March 9 high, which was the breakout point of the summer rally.
S&P500 Emini futures
A stock market fairy tale about a lame, but very strong duck
This is complicated, but it makes sense. At the very least, I find it interesting, and some of you might as well. Also, it is important, even if it has a 10% chance of becoming reality.
I don’t like to write about politics because it invariably will be emotional for some readers, and that is a distraction. We need to focus on what the markets are doing.
Sometimes, however, the political situation can have a significant impact on the markets, and when it might, it is worth discussing. In this case, the politics could result in a fast 20% selloff in January, and it is therefore worth mentioning.
President Trump is the most powerful man on earth… until January 20. He is a man who enjoys using his power. Do you think he will only use it to pardon himself and his friends, and fire some people he does not like? Or, do you think he will look for other ways to use his remaining brief, extreme power?
I suspect he will use as much of it as he can, and there are many possible things he can do. Some are unimaginable. He is a lame, but very strong duck. He has spent 4 years doing whatever he could to improve the chance of getting re-elected and to punish his enemies. It is worth considering what he might do to continue this behavior right up until January 20.
Follow the money, or see who benefits
Who are enemies that can only be damaged by a president? Well, other countries and the incoming president are good candidates. Which country is the one that his base loves to hate the most? Iran!!
I believe he would like to hammer them, and as would many Americans, especially his base. He might see this as improving his chances of getting elected again in 4 years. Also, it would create a huge problem for Biden, who wants to make nice with the Ayatollah, and for Macron and Merkel, whom Trump can’t stand. President Trump would love to leave a mess for them as he exits.
Would Trump bomb Iran? Nope. He recently discussed this with the Pentagon, and they dissuaded him. Also, he said no more wars in the Middle East.
Well, Iran has threatened to wipe Israel off the map many times. And Israel said that it will stop Iran from getting a nuclear weapon. Also, Israel knows that no president will ever be as supportive of it as President Trump. He is the best for them by a long shot. If they are going to do something, this is their best opportunity ever, and it is unlikely that they will ever have this kind of support from an American president again.
If Israel were to attack Iran, they would need US political and intelligence support. What if Trump fired the Pentagon brass earlier this month to put in people who would support a plan for Israel to attack Iran?
The pieces fit together. Follow the money, or at least think about whether enough people in power benefit sufficiently to try to make this happen. Israel just made friends with the UAE, which hates Iran. Saudi Arabia has to still be mad about Iran blowing up its oil fields. Both would love Israel to greatly damage Iran, and Israel and the U.S. would love to have the blessing of a couple Muslim nations to offset the certain worldwide condemnation.
If long, be careful starting on January 6
Is all of this a coincidence or a plan? I bet there are political forces at play that are trying to line things up to offer Israel the best opportunity it ever will have to attack Iran.
Will they seize the moment and attack? It is a huge decision, and I think they will not. But this is their best chance, and they know it.
The reason they will probably not attack is a fear of reprisals. Iran will send rockets into cities in Israel, and there would be an unbearable number of civilian casualties. The back and forth over the course of a month or two would be horrific.
If Israel were to attack, it would have to do it as soon as possible to get as much help as possible from President Trump. They would need clearance from President Trump, but he does not want to lose the 2 Georgia Senate seats on January 5. So that is why January 6 or shortly thereafter makes sense, if this is going to happen.
In fact, if President Trump is thinking about doing anything big and disruptive, he will probably wait until after January 5. And I think there is a good chance that he will do something big. If he does anything that affects the stock market, it would probably result in a selloff and not a rally.
If Israel bombs Iran, the stock market will fall
An attack on Iran would cause a quick 20% selloff in the stock market. Anyone long should consider buying puts on January 5, or at least be aware of an increased chance of a selloff.
What about the aftermath? If Israel were to attack, President Trump would deny any knowledge of the attack and condemn it in the mildest terms, while having the U.S. military intelligence secretly support it.
Absurdity can be reality in the right circumstances. Here is some more. An attack would provide the President with another laughable reason to stay in office after January 20. Even Mayor Bloomberg used a crisis to bypass term limits in NYC. President Trump would claim that the world’s new crisis needs stability, and his remaining in office would provide that stability. Obviously, he could not stay in office, but his base would love him to make that bold claim.
Good chance of a final surprise
We have had a very surprising 4 years. Traders should be wary of a final surprise. A surprise means something unthinkable or very unlikely… a low probability event.
I know many of you think this is conspiracy nonsense with no chance of it happening. I agree that it is conspiracy nonsense, but we have an unpredictable president, and Israel has an unusually good opportunity to do something they have been talking about doing for years. Also, many countries might see this as a rare opportunity to do something to ensure their survival. Therefore, it, or some other big surprise, has a 10% chance of happening.
I want to emphasize that Israel attacking Iran is a low probability bet. But I think there is at least a 30% chance of some big surprise after January 5. If there is one, it could put a lid on the stock market for many months. This is consistent with the monthly chart, which appears to have limited upside for many months after December (see below). That makes it worth mentioning, especially since I haven’t heard it elsewhere.
Monthly Emini chart has big bull bar in November, but rally is stalling at September high
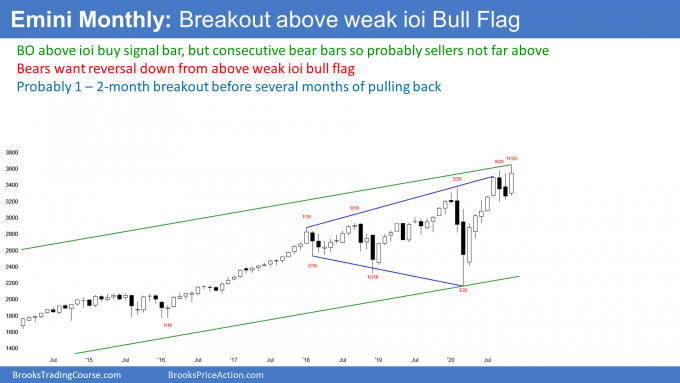
The monthly S&P500 Emini futures chart has been in a bull trend for a decade and a trading range for 3 years. The summer rally broke above the top of the trading range and the bulls are hoping that it will continue up for an 1100-point measured move up. While that will happen someday, it probably will not happen for many years.
Near-term, the Emini in November broke above the October high, which triggered a High 1 bull flag buy signal. While the Emini rallied to a new all-time high, it is now back at the breakout point of last month’s high.
I wrote last month that this was a weak buy setup. This is because October was a bear bar, and it was a 2nd consecutive bear bar. Also, the summer rally was climactic. Additionally, the break above the February high did not go very far before stalling. These factors all tend to limit the extend of the rally above last month’s high.
At top of likely 10-year trading range
I said that the rally might last a month or two, but probably not much more. What typically happens with a weak bull flag in a buy climax at resistance, is that the Emini soon goes sideways to down for many bars. How many? Maybe 5 to 10. That means that while the rally might continue into December, traders should expect that the Emini will be sideways to down for the 1st half of next year.
At that point, traders will decide on the direction of the next move. When the rally into 2017 became the most extreme buy climax in history, I said that the Emini would probably be mostly sideways for a decade.
It has been sideways for 3 years. While it is now at the top of the range, the odds still favor a trading range for many more years.
When there is a range, the Emini will test the top and bottom. We are now testing the top. At some point in the next few years, it is more likely than not that the Emini will test the bottom, which is this year’s low below 2200.
Getting near the end of the year
I want to make one final point. I have occasionally posted a yearly chart, and I will again at the end of the year.
This year is a big outside year (it traded below the 2019 low and above the 2019 high). Also, this is coming 10 years into a bull trend. Therefore, there is an increased chance that this year will be an exhaustive end of that trend. If it is, 2020 will probably not close on its high and not close above 2019.
Furthermore, there is an increased chance of it forming a doji bar. That means a close near the open of the year. The year opened around 3200. That is 12% below the November all-time high. While no one is talking about a selloff into the end of the year, it is a real possibility when a big outside bar comes late in a bull trend.
Weekly S&P500 Emini futures chart has bear inside bar after last week’s breakout above a 3-month trading range
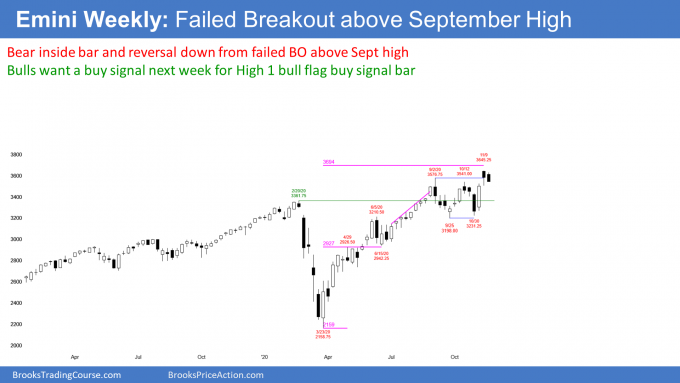
The weekly S&P500 Emini futures chart had a bear body this week. The low of the week was above last week’s low and the high was below last week’s high. This week is therefore an inside bar. That is a Breakout Mode pattern, which is often neutral. But with this week closing on its low and it being a 2nd consecutive bear bar, next week will probably trade below this week’s low.
The bulls see this week as a High 1 bull flag buy signal bar. It is a pullback from last week’s breakout to a new all-time high. However, consecutive bear bars make this a weak buy setup. There probably will be more sellers than buyers above last week’s high.
This week is also a sell signal. The bears see it as a sign that last week’s breakout is failing. They want a reversal back down to the bottom of the 3-month trading range. Ultimately, they want the reversal to continue down to the middle of the 3-year trading range.
With this week closing near its low after last week’s break above the 3-month range, there is an increased chance of a reversal down and possibly a gap down next week. If there is a big selloff next week, with or without a big gap down, traders will expect lower prices for at least another week after that.
Daily S&P500 Emini futures chart stalling at September high
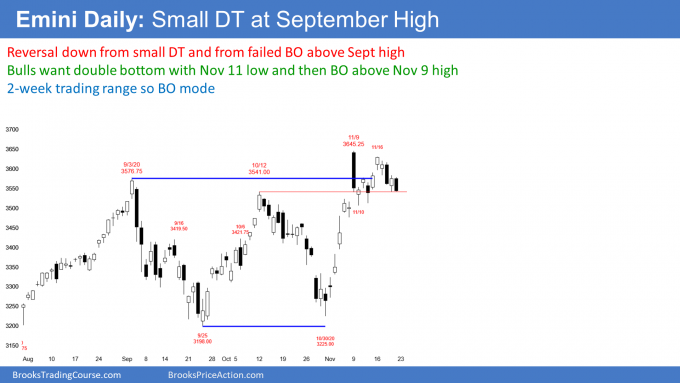
The daily S&P500 Emini futures chart has been sideways for 2 weeks. It has been oscillating around the September high and bouncing off the October 12 high. That was the breakout point of the rally 2 weeks ago. It is the neckline of the September/October double bottom.
The bulls see the 2-week trading range as a bull flag. They expect a strong break above the November 9 all-time high and then a 150-point measured move up, based on the height of the trading range. They will probably need a bull bar early next week before the rally can resume up.
However, the bears see a small double top. They want a breakout below the November 10 low, which is the neck line of that double top. It is also below the October 12 high, which is the breakout point of the September/October double bottom.
With Friday’s close back at the October 12 high after 2 tests of that breakout point last week, there is an increased chance of a break back below that breakout point. That would likely lead to a deeper pullback, like to the middle or bottom of the November rally.
It is important to note that the Emini has been in a trading range for 4 months. It is now at the top of the range. As strong as the rally was 2 weeks ago, there were no consecutive bull bars closing near their highs. That is a weak rally. Furthermore, the Emini has had a hard time getting bars to close above the September high. This is a problem. It increases the chance of a reversal down.
What will happen next week?
What is more likely, a successful break above or below the 2-week trading range? They are about equally likely. But if there is a break above, it probably will reverse down before reaching the measured move target around 3800.
If there is a break down with consecutive closes below the November 10 low, the Emini should fall at least to the middle of its 3-month trading range and possible to the bottom.
Sounds unclear? It should, because confusion is a hallmark of a trading range, and the Emini has been in a small trading range for 2 weeks, and at the top of a 4-month trading range. Traders are looking for reversals every few days and they are taking quick profits. Traders will continue to trade that way until there are consecutive closes above or below the range. There is nothing compelling going on right now, which means traders expect reversals.
Might get 2nd leg down from September high
The last time that the Emini was clearly trending strongly was at the September 2 high. Everything since then has been disappointing for the bulls and the bears. Consequently, everything since then is probably still a sideways pullback from the September 2 high.
It is possible that the 3-month trading range is just a complex 2-legged correction. The 1st leg down ended with the September 24 low.
While it is possible that the October 30 low was a 2nd leg down and the end of the correction, it is equally possible that the 2nd leg down has not yet begun. Sometimes there is a trading range after a 1st leg down, and then there is a 2nd leg down.
Given how disappointing the rallies have been, there is at least a 50% chance that the November rally is simply a pullback from the 1st leg down. If so, the rally will probably not go much higher before the 2nd leg down begins. The objective would be a test of the bottom of the 1st leg down, which is the September 24 low and the bottom of the 4-month trading range.
Trading Room
Traders can see the end of the day bar-by-bar price action report by signing up for free at BrooksPriceAction.com. I talk about the detailed Emini price action real-time throughout the day in the BrooksPriceAction.com trading room. We offer a 2 day free trial.
Charts use Pacific Standard Time
When I mention time, it is USA Pacific Standard Time (the Emini day session opens at 6:30 am PST, and closes at 1:15 pm PST). You can read background information on the intraday market reports on the Market Update page.

