Market Overview: S&P 500 Emini Futures
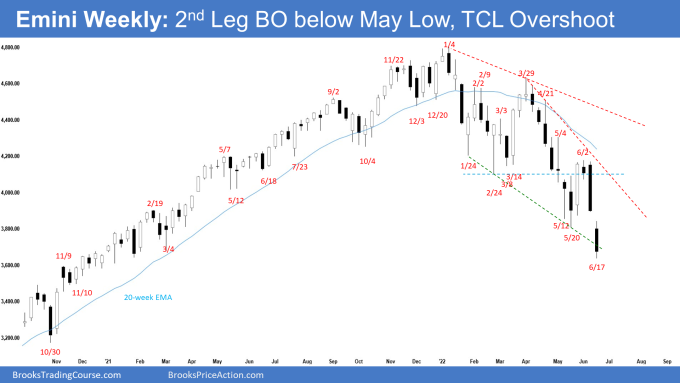
The S&P 500 Emini futures gapped down and broke below the May low. Bears want a continuation to measured moves below around 3600 and 3450. While the bulls have a trend channel line overshoot, they need at least a micro double bottom or a strong bull reversal bar before they would be willing to buy aggressively.
S&P500 Emini futures
The Weekly S&P 500 Emini chart

- This week’s Emini candlestick was a bear bar with a prominent tail below. It gapped down on Monday and closed below May low.
- Last week, we said that odds slightly favor at least slightly lower prices, and the bears want another bear bar which will increase the odds of a breakout attempt below the May low, while bulls want a bull reversal bar even though the Emini may trade lower first.
- The gap this week remained open which was a sign of strength from the bears.
- The bulls want a failed breakout below the May low.
- They see a trend channel line overshoot, and a wedge bottom (Feb 24, May 20 and June 17).
- However, since this week’s candlestick had a big bear body, it is not a good buy signal bar for next week.
- Bears want a continuation of the measured move down to 3600 or lower around 3450, based on the height of the 12-month trading range starting from May 2021.
- This week’s candlestick was a bear bar closing in the lower half of the range. It is a sell signal bar for next week.
- There was only 1 bull bar in the last 11 weeks. That means persistent selling.
- With the last 2 candlesticks closing near the low, odds continue to favor slightly lower prices.
- However, the trend channel line overshoot increases the odds of a 2-legged sideways to up pullback beginning within 1 to 3 weeks.
- The bulls will need at least a micro double bottom or a strong reversal bar before they would be willing to buy aggressively.
- For now, odds slightly favor sideways to down for next week.
- Bears want another bear bar closing near the low. Bulls on the other hand want next week to close near the high as a bull reversal bar with a long tail below even though the Emini may trade slightly lower first.
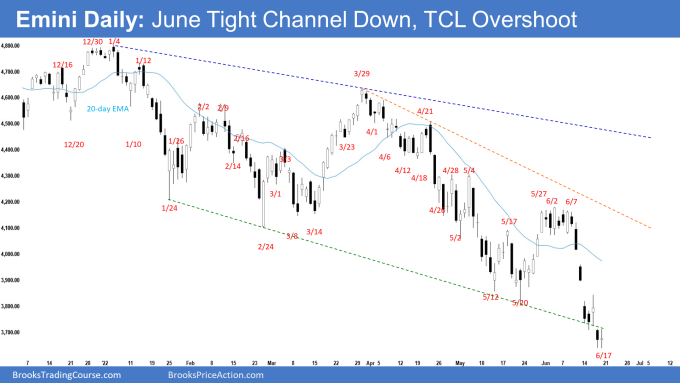
The Daily S&P 500 Emini chart

- The Emini gapped down on Monday and traded sideways for several days. Wednesday traded slightly higher but failed to close the gap.
- Thursday gapped down once again but closed with a prominent tail below. Friday was a bull doji overlapping Thursday’s range.
- Last week, we said that the bears will need to create consecutive bear bars closing near the low to increase the odds of a breakout below the May low.
- If the Emini stalls around the May low and the bulls get a strong bull reversal bar or a micro double bottom, we may see bulls return for a double bottom major trend reversal higher.
- The bears got the breakout below May low this week with follow-through selling.
- Bears want a continuation of the measured move down to around 3600 based on the height of the 9-month trading range or lower around 3450 based on the height of the 12-month trading range starting with May 2021.
- The bulls want a failed breakout below the May low. They will need to start creating consecutive bull bars closing near their highs to convince traders that a reversal higher may be underway.
- The bulls want a reversal higher from a trend channel line overshoot and a wedge bottom (Feb 24, May 20 and June 17).
- While there is a micro double bottom on Jun 16 and Jun 17, those are likely just sideways consolidation bars.
- Since Friday was only a bull doji, it is a weak buy signal bar for Tuesday.
- The problem with the bull’s case is that the move down since June 9 is in a tight channel. It increases the odds that the bears will get at least a small second leg sideways to down after a slightly larger pullback.
- The bulls will need to create a strong reversal bar following the trend channel line overshoot or a more credible micro double bottom.
- For now, odds slightly favor sideways to down and at least a small second leg sideways to down after a slightly larger pullback.
- However, because the selling is climactic with a trend channel line overshoot, traders should be prepared for at least a small 2-legged sideways to up pullback to begin within 1-3 weeks.
Trading room
Traders can see the end of the day bar-by-bar price action report by signing up for free at BrooksPriceAction.com. Al talks about the detailed Emini price action real-time throughout the day in the BrooksPriceAction.com trading room. We offer a 2 day free trial.
Market analysis reports archive
You can access all weekend reports on the Market Analysis page.


Thanks Andrew for an excellent report! I pay attention to the position of the open/close of the bars and last 2 trading days represent sort of an PA holding happening below the bear trend channel line representing bulls price absorption, I think. Wondering re bulls that have entered the 3/29 close that was a reasonable entry, how they behave?
Dear Eli,
Thanks for going through the report..
Regarding the last 2 bars, I was tempted to call a bounce from a micro double bottom following a trend channel line overshoot..
However, the weak bull bars with no follow-through made me doubt. It may be a trap attracting eager bulls to buy..
Regarding buying at the leg high on 3/29, I reckon they may be holding and look to add lower, but once the big bear bar after 4/21 appeared, they may give up there..
Take care and have a blessed week ahead Eli.
Best Regards,
Andrew
The market raced down to the bottom of the trend channel with strong bear bars and big unfilled gaps but once it got there the character changed with 3 overlapping bars and then two bars that broke under the channel which feature prominent tails below. Perhaps the bears were a little reluctant to press ahead of a long weekend? I guess we’ll know soon enough!
Dear Andrew,
A good day to you.
Yeah.. it’s possible the bears got reluctant once it broke below the trend channel line..
It was really a tough call this week..
Let’s see how it plays out next week.
Have a great week ahead Andrew!
Best Regards,
Andrew
Well, Andrew, Eli, CZ,
You guys called it right this week.. well done!
A bullish week so far..
Have a great weekend ahead!
Best Regards,
Andrew
Nice Analysis Andrew. We have a nested wedge bottom and a small second leg after 7 weeks down. The doji on Friday and nested wedge gives the bulls a strong case to attempt a rally next week starting as soon as Tuesday. While the move down as been very strong since June 9th, this very well could be exhaustion. A 50 percent retracement of the move down from June 9th is what I expect leading us to the MA at minimum before the bears attempt again.
Dear CJ,
Thanks for going through the report.
It certainly could be an exhaustion sell-off.
But the lack of strong bull bars down since June 9 is a concern for me.
That’s why despite the trend channel line overshoot and micro double bottom, I’m still wary of trying to call the reversal too soon..
Let’s monitor this day by day and see how this plays out next week.
Have a blessed week ahead CJ!
Best Regards,
Andrew