Market Overview: S&P 500 Emini Futures
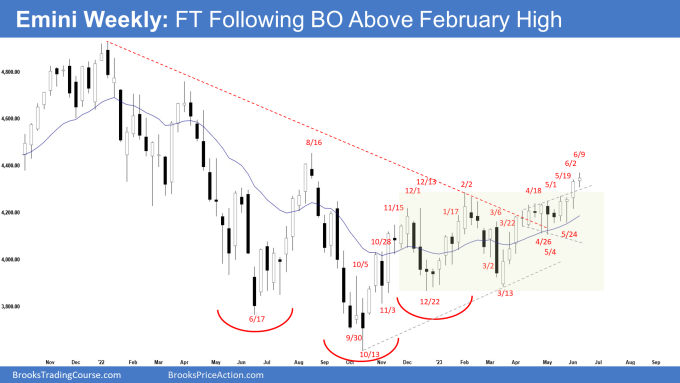
The S&P 500 Emini futures weekly candlestick was a bull doji therefore the bulls got buying follow-through following last week’s breakout above the February 2 high. The bull’s next target is the August high. The bears want a failed breakout above the February 2 high and a reversal down from a wedge pattern (Dec 13, Feb 2, and Jun 9) and a double top with the August high.
S&P500 Emini futures
The Weekly S&P 500 Emini chart

- This week’s Emini candlestick was a bull doji closing slightly above the middle of the week’s range and above last week’s high.
- Last week, we said that odds continue to favor the market to still be in the sideways to up phase until the bears can create credible selling pressure.
- The bulls got buying follow-through bar (albeit weaker) following last week’s breakout above the February 2 high.
- They want another strong leg up completing the wedge pattern with the first two legs being December 13 and February 2. The third leg up is currently underway.
- They got a breakout from the 6-week tight trading range which turned into a bull flag.
- They want a breakout far above February 2 high followed by a measured move using the height of the 6-month trading range which will take them to the March 2022 high area.
- The next target for the bulls is the August 2022 high.
- The bears want a reversal down from a wedge pattern (Dec 13, Feb 2, and Jun 9) and a double top with the August high.
- They hope that the 6-week tight trading range is the final flag of the leg up and want a failed breakout above the February 2 high.
- If there is a failed breakout, it would usually occur within 5 bars after the breakout.
- The problem with the bear’s case is that they have not been able to create credible selling pressure since the March low.
- They will need to create strong bear bars with follow-through selling to convince traders that a deeper pullback could be underway.
- At the very least, the bears will need a strong reversal bar or a micro double top before they would be willing to sell more aggressively.
- Since this week was a bull doji, it is a weaker buy signal bar for next week. It is not a strong sell signal bar.
- While the odds slightly favor the market to still be in the sideways to up phase, a minor pullback can begin at any moment.
- Traders will see if the bulls can continue creating consecutive bull bars or will the Emini stall around the current levels and begin the pullback phase.
The Daily S&P 500 Emini chart

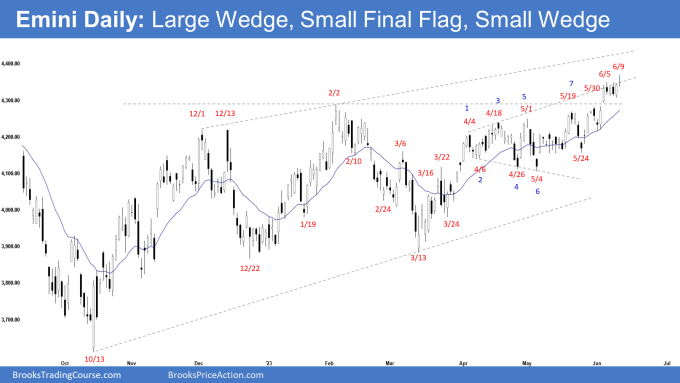
- The Emini was trading sideways throughout most of the week but broke higher on Friday, closing as a doji bar.
- Previously, we said that the odds continue to slightly favor the market to still be in the sideways to up phase until the bears can create strong bear bars.
- The bulls got some follow-through buying following last week’s break above the February 2 high.
- They want a measured move up using the height of the 6-month trading range which will take them near the March 2022 high.
- They will need to break far above the August high with follow-through buying to increase the odds of reaching the measured move target.
- The bears have not yet been able to create sustained follow-through selling.
- They see the move up from October 2022 simply as forming a large wedge (Dec 13, Feb 2, and Jun 9) within a broad bear channel.
- They hope that the tight trading range this week (Monday to Thursday) formed a smaller final flag in the current leg up.
- They see a smaller wedge (May 30, Jun 5, and Jun 9) forming too.
- If the Emini trades higher, they want the market to stall around the trend channel line.
- The bears will need to create strong bear bars with follow-through selling to increase the odds of a deeper pullback.
- Since Friday was a bear doji bar, it is a neutral signal bar for Monday.
- The breakout above the February 2 high so far has a lot of overlapping candlesticks. It’s not as strong as the bulls hope it would be.
- Because of the lack of strong bear bars with follow-through selling, odds continue to slightly favor sideways to up.
- This can change if the bears manage to create strong consecutive bear bars closing near their lows (bear spike) next week.
- If there is a pullback, a reasonable target would be the breakout point (February 2 high) or the 20-day exponential moving average area.
- Traders will still expect at least a small leg to retest the current leg extreme high (Jun 9).
Trading room
Al Brooks and other presenters talk about the detailed Emini price action real-time each day in the BrooksPriceAction.com trading room. We offer a 2 day free trial.
Market analysis reports archive
You can access all weekend reports on the Market Analysis page.


I am curious about the levels on your chart (e.g. weekly) – I have checked TOS and trading view and they are dramatically different. For example we are far above Aug 2022 high and your chart and descriptions talk bout getting close to it. Any ideas would be appreciated. Thanks
Ola Jason, I saw that your question has been answered in the FB group by others..
Thanks for going through the report..
The ticker for the chart on Tradestastion for the chart is @es.d
Best Regards,
Andrew
Ola again Andrew..
Yeah.. agreed..
But at this moment, nothing surprises me anymore..
Millions dead and dying, businesses close throughout the whole world.. literally like the end of the world.. and market continue to make new highs for weeks and months.. (During Covid Period)
Have a blessed week ahead..
Best Regards,
Andrew
Hi Andrew
My best explanation for this is that 1. investors need to put their funds somewhere, and the big-cap tech giants (and other entrenched non-tech giants) who lèad the major world equities indicies are seen as the current and “future” producers, and 2. the major equities indicies are known to have some inherent strength in that they regularly reset with weaker companies exiting the index and stronger companies enterring the index.
But the once-a-decade major corrections keep repeating when a shocking catalyst occurs eg unexpected màjor financial crisis.
Good day to you Graeme,
Thanks for going through the report..
Good explanations.. I agree with that was said..
Thanks for your time and have a blessed week ahead!
Best Regards,
Andrew
The option market is almost frighteningly complacent with the VIX falling to a post-pandemic low last week.