- Market Overview: Weekend Market Analysis
- 30-year Treasury Bond futures
- Bond futures on weekly chart broke below a 9-month trading range
- EURUSD Forex market
- EURUSD monthly chart has a wedge rally to top of 6-year trading range
- EURUSD daily chart has a weak rally, which might be the start of a trading range
- S&P500 Emini futures
- The Emini on Monthly chart is breaking above bull channel
- The Emini on Weekly chart is in a Small Pullback Bull Trend
- The Emini on Daily chart is breaking above bull channel, but the breakout will probably fail
Market Overview: Weekend Market Analysis
The SP500 Emini futures bull trend is strong and traders expect higher prices. But it is breaking above bull channels on the daily and monthly charts, and any breakout above bull channel typically fails by about 5 bars.
The bond futures market is breaking below a 9-month triangle and a bull trend line. If there is follow-through selling next week, traders will expect a measured move down.
The EURUSD Forex market is stalling at the top of a 6-year trading range. If the rally does not accelerate soon, traders will look for a 3-week pullback.
30-year Treasury Bond futures
Bond futures on weekly chart broke below a 9-month trading range
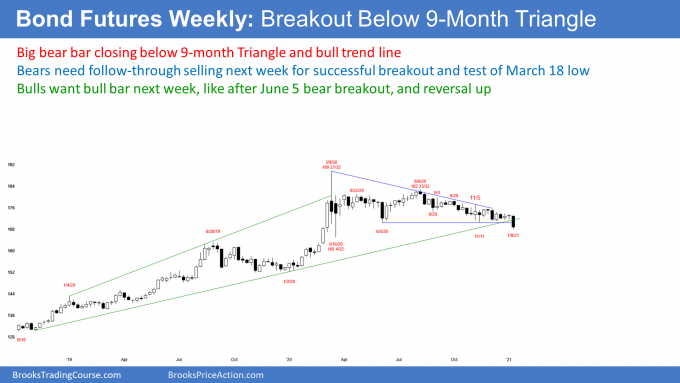
Bond futures on the weekly candlestick chart finally broke below their 9-month trading range this week. While I have been saying that the bond market will be lower 5 and 10 years from now, it had been neutral for 9 months. Not any more. The odds favor lower prices.
But what happens next week will affect those odds. Next week is the follow-through bar. At a minimum, the bears want at least a small bear body. That would further increase the chance of lower prices over the following several weeks. Traders will begin to look for a 12-point measured move down to around 158 based on the height of the 9-month trading range. That is just above the January 2, 2020 low, which is the bottom of last year’s 3-month buy climax. It is therefore an important magnet. The bigger the bear follow-through bar and the more it closes on its low, the stronger the bear trend. That means bonds would probably fall lower and faster.
If next week reverses up and closes on its high, like it did after the June 5 bear breakout, traders will conclude that the breakout has failed. They will expect higher prices over the next few weeks, and possibly a break above the bear trend line and a test of the August high. With this week’s close, the bulls currently have a 25% chance of that happening over the next few months.
What if next week is a small bull or bear bar that closes in the middle? That would be disappointing for the bears, but they would still be in control. Traders would then look for either follow-through selling, or a reversal up on the following week, to give a clue about the direction for the next couple months. At the moment, traders expect lower prices.
EURUSD Forex market
EURUSD monthly chart has a wedge rally to top of 6-year trading range
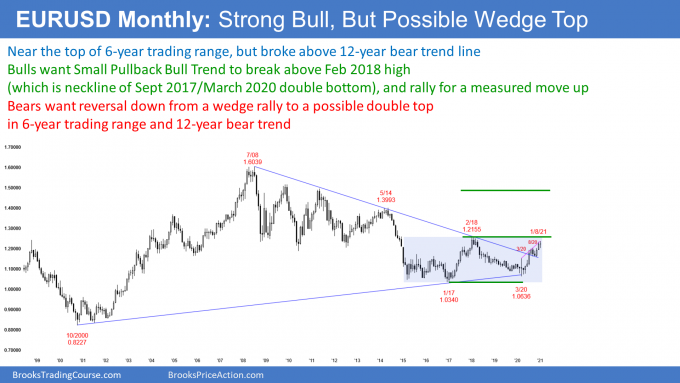
The EURUSD monthly chart has rallied since March. However, as strong as the rally has been on the weekly and daily charts, the rally on the monthly chart is still just a bull leg in a 6-year trading range. The bulls need a couple closes far above the February 2018 high, before traders will conclude that the monthly chart has converted to a bull trend. If it does, and it probably will either this year or next, traders will conclude that the bull trend that ended in July 2008 is resuming.
If the bulls get their strong breakout, traders will look for a measured move up based on the height of the 6-year range. That would be above the May 2014 high.
But it is important to understand that most attempts to break out of a trading range fail. Consequently, it is more likely that the EURUSD will reverse down for a least a couple months, before breaking strongly above the February 2018 high. If it does, it will be from a wedge rally to a double top. That is a reliable topping pattern. It could lead to a couple legs down. On the monthly chart, that could last several months.
Can the EURUSD break below the 2017 low? That is the neck line of the double top. If it did, traders will look for a measured move down to the October 2000 low. It is more likely that a reversal down will just prolong the trading range. It has gone on for 6 years. Traders should not be surprised if it continued for another couple years.
The bear channel from the July 2008 high is probably a bull flag. The selloff has held above the October 2000 bottom of the bull trend. The EURUSD has broken above the 12-year bear channel this year. That converted the bear channel into a trading range.
If the bulls can continue the rally, the trading range will convert into a bull trend. But as I said, there will probably be a pullback for several months beginning soon. However, because of the break above the 12-year bear channel, the odds favor a breakout above the February 2018 high at some point this year.
EURUSD daily chart has a weak rally, which might be the start of a trading range
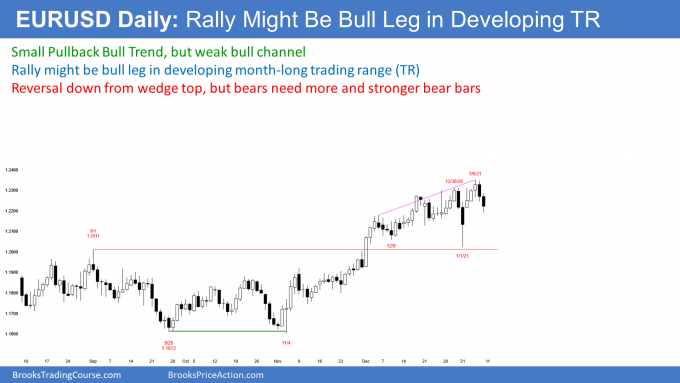
The EURUSD daily chart has been in a bull trend since March. However, the rally from the December 9 low has been weak. Furthermore, the big 2-day selloff on December 31 and January 1 created confusion.
Yes, the EURUSD made a new 20-month high this week. But it has been unable to break strongly above 1.23, despite 5 attempts since mid-December.
Also, as I mentioned above, the EURUSD is near the top of a 6-year trading range. There is a 50% chance that the EURUSD will test down again to 1.20 at the bottom of the month-long trading range before continuing up to 1.25. Consecutive bull bars closing above this week’s high would shift the probability in favor of a test of 1.25 within a month.
S&P500 Emini futures
The Emini on Monthly chart is breaking above bull channel
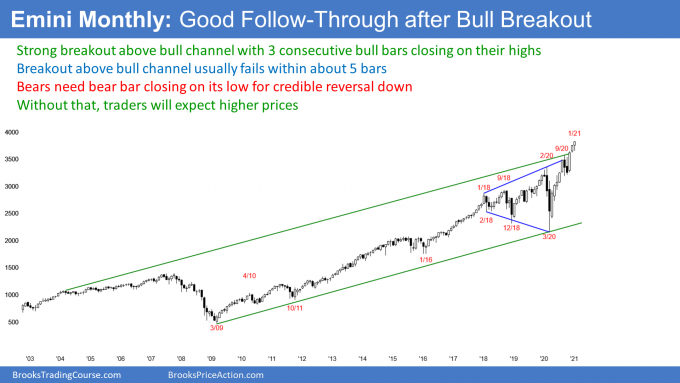
The monthly S&P500 Emini futures chart broke to a new all-time high this week. This month’s candlestick is currently a bull bar. It is the 3rd consecutive bull bar after the October High 1 bull flag. But since September and October were both bear bars coming late in the strong reversal up from the pandemic low, the buy setup was weaker. A rally from a weak bull flag in a buy climax usually stalls after a couple bars. January is the 3rd bar. That increases the chance of a pullback in January.
Can the rally continue up for 10 consecutive bull bars? Why not? Look back at the S&P in 1995 (not shown). The market tripled in the next 5 years. But that kind of acceleration up happens only 25% of a time. Each bull bar that gets added increases the chance of higher prices. Also, it makes traders more eager to buy a pullback.
The bulls will continue to buy as long as the chart keeps creating strong bull bars. Furthermore, the rally from the March 2020 low has only had one pullback and it lasted only one bar (September). That is very strong. Traders will therefore buy any 1- to 3- bar (month) pullback in 2021. They might get their chance in January or February.
The Emini on Weekly chart is in a Small Pullback Bull Trend
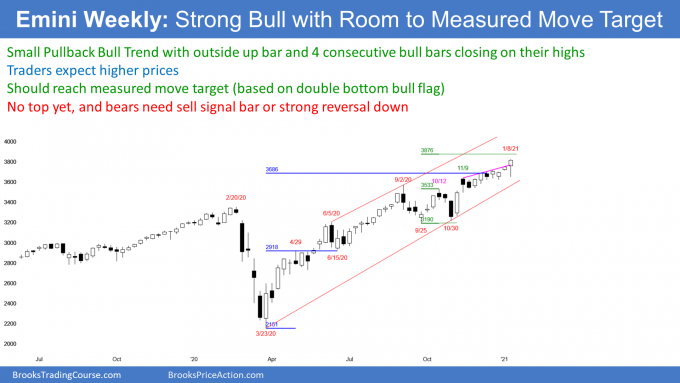
The S&P500 Emini futures on the weekly chart has been in a strong bull trend since March. This week was an outside bar. The Emini traded below last week’s low and then above last week’s high. It also closed on its high and at an all-time high. Additionally, this is the 4th consecutive week closing near the high of the bar.
The rally from the October low is accelerating, and next week might gap up. It does not matter that the rally is extreme and that an extreme rally increases the chance of a strong reversal down. A buy climax can go much higher and last much longer than what you might think is reasonable. Until there is a credible top or a strong reversal down, traders will continue to expect higher prices.
The Emini on Daily chart is breaking above bull channel, but the breakout will probably fail
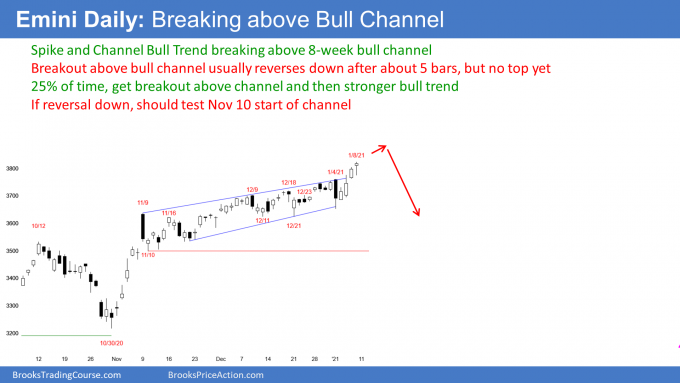
The daily S&P500 Emini futures chart rallied strongly after Monday’s big selloff. It is breaking above the top of the bull channel that began on November 9.
While that is a sign of strong bulls, traders must understand that only 25% of breakouts above bull channels result in a stronger bull trend. Instead, there is a 75% chance of a reversal down within about 5 bars. Therefore, as strong as the bull trend has been, traders should be ready for a possible reversal down next week.
If there is a reversal down, how far will it go? The first target is the bottom of the bull channel, which is the bull trend line. Because the bull channel is tight, that is only a small correction down to around 3700. If there is a blow-off top and a reversal down, it will probably last a few weeks and drop lower than what traders might expect.
For example, a reversal down from a bull channel often reaches the start of the channel. That is the November 10 low at around 3500. But as long as the bull trend continues to form bull bars closing near their highs, traders will buy. However, if there is a reversal down, it could be fast, like after the September 2 blow-off top. The market fell 10% over the next 3 weeks.
Trading Room
Traders can see the end of the day bar-by-bar price action report by signing up for free at BrooksPriceAction.com. I talk about the detailed Emini price action real-time throughout the day in the BrooksPriceAction.com trading room. We offer a 2 day free trial.
Charts use Pacific Standard Time
When I mention time, it is USA Pacific Standard Time (the Emini day session opens at 6:30 am PST, and closes at 1:15 pm PST). You can read background information on the intraday market reports on the Market Update page.


Not sure if it is too much to ask, given the help we get, nor I want to sound ungrateful; I was hoping if there is a Technical Analysis section on Nasdaq100 (similar to e-mini, EURUSD, and BOND, or an abridged version) that would be wonderful. In future. At present I call shot on Technology funds by eyeing on e-mini’s target. It works well just that I juggle a few charts while in action. Thanks again! No rush.
I would love to do more, but I am already doing too much.
The correlation between the Nasdaq and the S&P is 97%. Therefore, they almost always move together.
However, it is important to know that the volatility of the Nasdaq is 20% greater. So they move in the same direction almost all of the time, but the moves in the Nasdaq are usually bigger.
I have noticed that the correlation between the Dow and S&P is also similar. What about the volatility?
Hi Al,
Thanks for your analysis. Do you have any idea or analysis on the outside bar created this week on next week impact?
An outside up bar closing on its high and above the last bar’s high increases the chance of at least slightly higher prices. However, the breakout above the bull channel on the daily chart increases the chance of a minor reversal down by the end of the coming week.