Monthly S&P500 Emini futures candlestick chart:
Breakout and Emini August buy climax
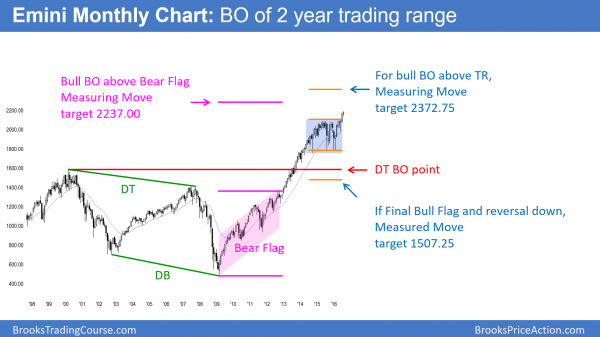
The Emini has had 7 consecutive bull trend bars on the monthly candlestick chart. While last month was a strong bull breakout, this month so far is a doji bar. That is therefore weak follow-through buying. Hence, it increases the chances of a pullback soon.
There are monthly measured move targets above and no sign of a top. Yet, an overbought rally can pull back at any time.
The monthly S&P500 Emini futures candlestick chart is having its 7th consecutive bull trend bar this month. Because this is unusual on the monthly chart, it is unsustainable. It is therefore a type of buy climax. The minimum objective for the bears is a bear body this month. Hence, all that they need is a close that is 1 tick below the open. They obviously are looking for a reversal down, but that is their minimum objective.
Possible Final Bull Flag
The bulls have a gap between the August low and the top of the 2 year trading range. While the gap might lead to a measured move up, when a gap occurs after 20 bars in a trend, it is more likely an exhaustion gap. This gap is 7 years, or about 80 bars into the bull trend on the monthly chart. It is therefore more likely an exhaustion gap. Hence, the 2 year trading range is probably the Final Bull Flag before a TBTL Ten Bar Two Leg pullback. Ten bars on the monthly chart is about a year.
If the 2 year trading range does become the Final Flag, the reversal down will probably test its low. That is around 1800. From there, the bulls would want a double bottom bull flag and trend resumption up. The bears would want the reversal down from the Final Flag Top to lead to a bear trend. If it does, the next target is the 1500 area. That is the top of the double top.
The bull case
The Emini is in a bull trend. Most reversals fail and become bull flags. The odds are that bulls will buy the 1st reversal down. Because the odds favor closing the gap above the 2 year trading range, if there is a reversal down over the next month, it will probably fall below the June high. Yet, bulls will correctly see the selloff as a bull flag. They will therefore buy the reversal up.
The Emini in July broke above a trading range that was 300 points high. The target for the bulls is a measured move up to 2400. Once there, they will probably take profits. Hence, they would create another pullback or trading range.
The momentum up for the past 7 months and for the past 7 years has been strong. The bulls will keep buying strong reversals down until the bears begin to form lower highs. Until then, the odds are that the trend up will continue, even though the rally is already unusually long.
Weekly S&P500 Emini futures candlestick chart:
1st bear trend bar in 8 weeks
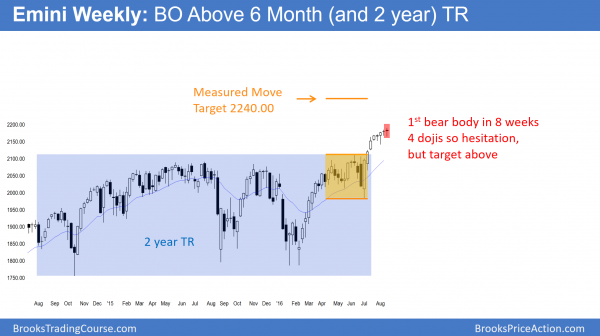
The weekly S&P500 Emini futures candlestick chart finally had bear body this week after 7 consecutive bull bodies. This week was also an outside down candlestick pattern. Yet, it closed above last week’s low, and is therefore not very bearish.
The Measured Move target based on the height of the 6 month trading range is 2240.00. There is no top yet, but an overbought rally can reverse down at any time.
The weekly S&P500 Emini futures candlestick chart had 7 consecutive bull trend bars. That is unusual and therefore unsustainable. It therefore is a type of buy climax. Yet, it is still forming higher highs every week and there is no clear top.
By trading below last week’s low, this week was the entry bar for a 2nd entry short for a failed breakout above the 2 year trading range. However, the past 4 weeks were dojis and in a tight channel. Also, they follow a strong bull breakout. This reduces the chances that a reversal down would become bear trend. Hence, bulls will look to buy the pullback. However, they are aware that the pullback might be deep and fall below 2100 and back into the 2 year trading range.
Has the pullback begun?
While there is a 60% chance of a 50 – 100 point pullback before a rally above the 2220 target on the daily chart, there is still no clear top. Furthermore, there is no strong bear breakout. Yet, the context is good for the pullback coming soon. Until there is a strong bear breakout, the odds still favor at least a little more up. However, because the context is so good, that bear breakout could come anytime, including next week.
Daily S&P500 Emini futures candlestick chart:
Final Flag Top or Wedge Top?
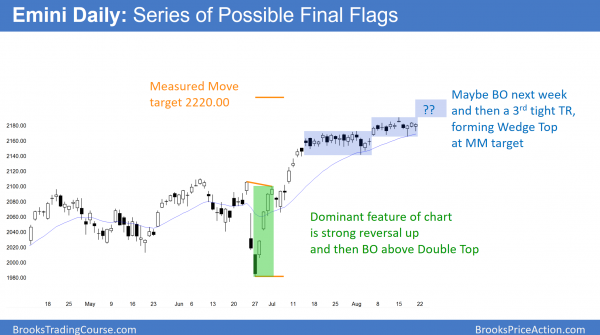
The daily S&P500 Emini futures candlestick chart is in a tight trading range, slightly above the July tight trading range. It is in Breakout Mode. This is a Final Flag Top. Yet, there are magnets above. If the Emini rallies to those magnets and then turns down, there will be a Wedge Top.
The daily S&P500 Emini futures candlestick chart is the most interesting. The strong bear breakout in June followed by the strong reversal up in July resulted in a double top. The tops were June 23 and July 1. That reversal is the dominant feature on the daily chart. It therefore has the most influence. The bulls are looking for a measured move up from the breakout above that double top. The target is 2220.00.
There are also measured move targets around 2200 based on the July and based on the August. Also, 2200 is a big round number and therefore a magnet.
One push up to wedge top at measured move targets?
The Emini had a tight trading range in July and another one in August. A reversal down from here would be a Final Flag top where the July trading range was the Final flag.
The channel up from the July 6 pullback has been tight. Hence, the odds favor a 3rd push up. If there is a 3rd push up, it would create a wedge top. That top would probably be around the 2200 – 2220 targets. A reversal down from a wedge top usually lasts at least 10 bars and has at least 2 legs. This rally has lasted so long that the reversal down could last 10 bars on the weekly chart (10 weeks).
The rally on all time frames has been strong. Furthermore, there are magnets just above. The odds favor a test of those magnets before a reversal down begins. Yet, if a top is so obvious that everyone expects it, traders begins sell below resistance. They want to be sure to have at least a small position on before the expected big bear breakout comes. Because they believe a top will form now or soon, they think the risk of the early short is small. If enough traders start to sell below the target, the reversal down will begin without reaching the target.
Black Swan rally?
Everyone knows that the Emini needs a pullback after so many weeks up without one. The stops are far below. Bulls have big open profits. They have to reduce risk, and the easiest way is to take profits. That selling creates the pullback. Whenever anything is obvious, traders need to pay particular attention to the opposite.
When there is high probability one way, there is low probability the other way. Hence, everyone ignores the low probability direction. If the market begins to go in the low probability direction, traders are in denial. However, this results in bears trapped in as they sell new highs. Bulls don’t buy because they also think the rally will fail.
However, even a little rally can be enough to quickly make the bulls and bears worried. Both will begin to buy, and then buy in a panic. Hence, the low probability event can quickly turn into a rally that can continue up for a long time. Bears keep selling, picking tops, bulls keep scalping out. Yet, there is not enough selling to turn the market down. Bulls and bears therefore have to keep buying as the market goes up. Sometimes the buying is climactic. Other times it is a small pullback bull trend. If the Emini continues up above 2220, it might go up to 2400 before pulling back.
Traders can see the end of the day bar-by-bar price action report by signing up for free at BrooksPriceAction.com. I talk about the detailed Emini price action real-time throughout the day in the BrooksPriceAction.com trading room. We offer a 2 day free trial.
When I mention time, it is USA Pacific Standard Time (the Emini day session opens at 6:30 am PST, and closes at 1:15 pm PST). You can read background information on the intraday market reports on the Intraday Market Update page.


Al,
Thank you for your expertise.