Market Overview: Weekend Market Analysis
The SP500 Emini futures ended its streak of 13 consecutive bull days this week. That streak makes a 5 to 10% pullback likely to occur within the next month.
The EURUSD Forex market has been in a trading range for 9 months, with no sign that it is about to end. The 2-week rally is at minor resistance, which increases the chance of the chart going sideways for a week or two.
EURUSD Forex market
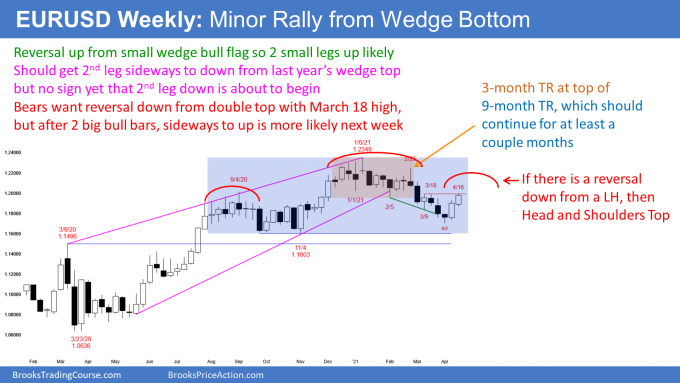
The EURUSD weekly chart in minor rally within 9-month trading range

- Consecutive bull bars after a 2-month wedge bottom in 4-month bear trend.
- Testing bottom of December to February trading range (tan-colored rectangle) at 1.20 Big Round Number.
- There is a gap between the lowest body in that trading range, and this week’s bull body.
- A gap down is a sign of strong bears. Bulls need to erase that bearish strength by closing that gap. They need body of a bull bar in this rally to overlap body of bear bar in that trading range.
- If gap gets closed, 4-month bear trend will have evolved into trading range. Then, 50-50 chance of test of January high, instead of test of November low.
- Since at resistance, increased chance of sideways for a week or two.
- 9-month trading range (blue rectangle) should continue for a couple months.
- If the rally forms a lower high over the next month or so, there will be a lower high major trend reversal.
- A lower high after a wedge top is the right shoulder of a head and shoulders top. If that forms, there would be a 40% chance of a breakout below, and a measured move down.
S&P500 Emini futures
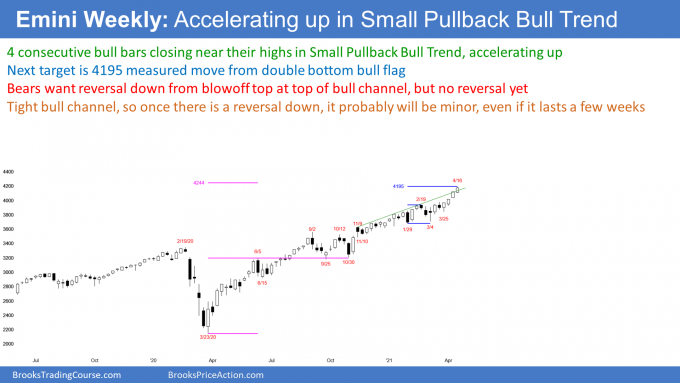
The Weekly S&P500 Emini futures chart accelerating up at top of bull channel

- 4 consecutive bull bars closing near their highs so strong rally.
- Breaking above top of tight bull channel that began with November 9 high.
- Breakout above bull channel usually fails within about 5 bars.
- Since no sign of top, bulls will continue to buy, despite buy climax at top of bull channel.
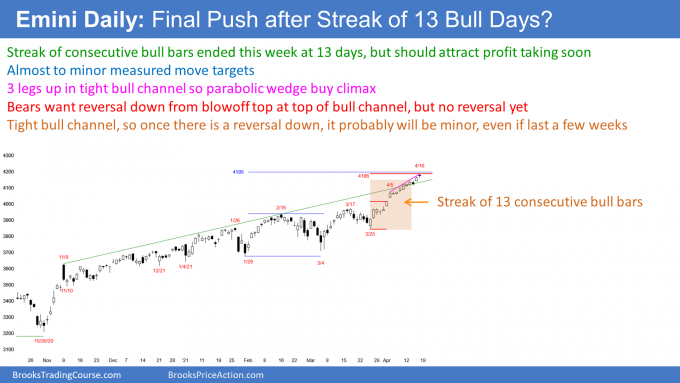
The Daily S&P500 Emini futures chart might be making final push after streak of 13 consecutive bull days ended this week

- 13-day bull micro channel ended when Wednesday traded below Tuesday’s low.
- Streak of 13 consecutive bull bars also ended on Wednesday.
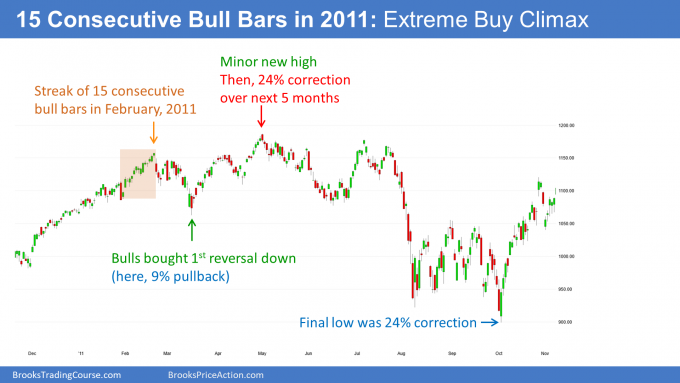
- That streak was the longest since February 2011.
- In 2011, while the Emini traded higher a month later, it was down 24% 8 months later. Here, below, is the 2011 streak of 15 consecutive bull days:

- Although similar patterns often have similar follow-through, the price action is rarely identical.
- The important points are that when there is an extreme buy climax, there is an increased chance of a deeper correction, and of a correction that lasts longer than recent pullbacks.
- The current streak should lead to a 5 to 10% pullback beginning within a month.
- There is no top yet, and the bulls are continuing to buy. There were two bear bars this week, which is a sign that bulls are starting to take some profits.
- Once the buy climax ends, the Emini will have a difficult time going much above that high for the next several months, and possibly for the rest of the year.
- Because the bull channel is tight, bulls will buy the 1st reversal down, even if it is 10%. They know even a strong reversal down has only a 30% chance of growing into a bear trend without first testing the high.
- Once the trend tests the old high, then the bears have a 40% chance of a major reversal, like in the summer of 2011.
Who’s buying at this point?
- A trade can only take place if there is someone who thinks the market will go up and someone else thinks it will go down. There are currently far more bulls than bears, and the market has to go higher to find enough bears who are willing to sell.
- Are traders buying now because they think the market is still cheap? No. Value bulls buy when the market sells off. They buy more when it sells off more. They are confident it will eventually rally, even if it takes a long time. They are patient and will not easily get scared out of their positions.
- There are two types of traders who buy late in a buy climax: FOMO bulls and momentum traders.
- A FOMO bull (Fear Of Missing Out) knows the risk is greater when buying in a buy climax, but he also knows the odds favor higher prices when the momentum is strong. He hopes that the market will be far above his entry price once there is a reversal, so that he will have little risk of losing money.
- A momentum bull buys simply because the momentum up is strong. He knows he will probably make money by buying.
- The FOMO bulls prefer to buy pullbacks, but ended up doing something that makes them uncomfortable.
- Remember, the F stand for Fear, and fear is an unpleasant emotion. They bought at the top of a buy climax. Because they are uncomfortable, they will be quick to exit if there is a reversal, which would make them unbearably uncomfortable. They will then go back to their preferred style of trading, which is to buy pullbacks.
- The momentum bulls are fast money traders, like scalpers on the 5-minute chart. They are looking for a profit within the next few days. If the market stalls, they will conclude that the momentum is no longer good. Since they bought because of good momentum, their reason to be long is no longer valid, and they get out.
- Both types of buyers will be quick to get out if the rally stalls or starts to turn down. As traders sell out of longs, the market drops. As it does, more bulls will sell, and so will bears. The market will fall more, and faster, as a cascade of traders sell. This is why a buy climax often ends with a very fast and big reversal down.
- It is also why there is an increased chance of a sharp reversal down within the next few weeks.
Possible blow-off top
- It is important to note that a buy climax also has an increased chance of accelerating up. That is a blow-off top.
- There are weak bears betting on a reversal, and they are starting to scale into shorts. Most have to exit at some point because otherwise their risk would become unacceptably huge for many of them. If the market fails to turn down, those bears will start to buy back their shorts, often in a panic and at any price.
- The FOMO bulls will buy even more aggressively as the market accelerates up because their fear of missing out increases.
- The momentum bulls like strong momentum, and they too will buy more aggressively.
- If there is a big acceleration up, many strong bulls will look at it as a great opportunity to take windfall profits.
- Strong bears will also sell and scale in higher. They are never going to be scared out of their shorts.
- That selling by strong bulls and bears can create a big reversal down, which can last a long time.
- The strong bulls will wait patiently until they are confident that the selling has ended before they will buy again.
- The strong bears expect at least a couple legs down and maybe a 10% correction, maybe 20%, so they too will not be quick to buy back their shorts.
Trading Room
Traders can see the end of the day bar-by-bar price action report by signing up for free at BrooksPriceAction.com. I talk about the detailed Emini price action real-time throughout the day in the BrooksPriceAction.com trading room. We offer a 2 day free trial.
Charts use Pacific Time
When I mention time, it is USA Pacific Time (the Emini day session opens at 6:30 am PT, and closes at 1:15 pm PT). You can read background information on the intraday market reports on the Market Update page.


Thank you for the report Al. Always a great tool for decision making here. Last year, in many reports, you seemed convinced that the emini was within a multi year trading range approximately between 1700 and 3200. With the index now at 4183 has your view changed? how do you interpretate the multiyear posture of the index? Do you think that the tech sector super rally due to covid-19 has somewhat distorted the index value? Thanks in advance for your time. E.
I think many experts believe that last year was the start of a new bull trend. They argue that the 2008 bull trend ended in 2018 and that what is happening now is a new bull trend.
It is more likely that the 3-year trading range was a pause in a 12-year bull trend. If I am right, then this yearlong strong rally is probably the final leg up and that the market should eventually test the bottom of that trading range, which is the pandemic low. There is no top yet and this rally could continue for many months and have several pullbacks before it ends.
The rally needs to continue for a couple more years and get far above 4,500 before the thesis of a new bull trend becomes more likely than a bull leg in a trading range that began in 2018.
Why do I think that the theory of a new bull trend is wrong? Because the trading range lasted only 3 years.
Look at the end of the bull trends in the 1970s and in 2000. The market went sideways for a decade before there was a new bull trend.
That is what typically happens. A 3-year trading range is more likely a pause (bull flag on the monthly chart) in a 12-year bull trend than the end of that trend.
Nothing is certain, but unless this rally continues for a couple more years, I still believe that the market began a trading range in 2018 and this is still part of it, even though the market broke strongly above that 3-year range. That means I believe there will be a selloff within a couple years back to the bottom of the 3-year trading range. That would create a trading range lasting about a decade, beginning in 2018.
Very insightful report as usual!
It looks like the weak bears buying back shorts may be a very large contributing factor in the continued rallying also. For example, on Thursday’s (4/15/21) open right near the highs of Wednesday’s session, the market may have trapped bears below the low probability bar 3 bear reversal bar for sellers looking for an opening reversal and mean reversion trade. Limit order bears at the highs of the TTR, could initially profit but it became harder as the range progressed. Traders who shorted above the 10:05 EST bear outside bar and scaled in above the bull trend bar that followed would’ve just barely been able to get out with a 1 point scalp. Limit order bears shorting the bar 1 and bar 3 highs as the TTR progressed would’ve been disappointed by the two bull bodies following the relatively large 10:10 bull trend bar (and the micro gap between the 10:10 bar high and 10:20 bar low). The 10:25 bull bar closing on its high leading to a buy vacuum and climax to a measured move based on the height of the trading range and new all-time high may have potentially occurred as quickly as it did as a result of those bears buying back their shorts.
Interestingly, the high 2 bull flag that led to another new all-time high up to a measured move based on the open to close of the 10:30 bull bar also seemed to be built on the backs of trapped bears. I believe this was the case since the low probability short below the three bar ledge in the pullback was a 5 tick trap.
On Friday (4/16/21), the majority of the session was a large triangle, until the 2:00 bull surprise bar closing far above many of the closes and extremes of prior bars. The market wound up pushing to a measured move based on the open to close of the 2:00 to 2:10 bull bars before forming a very strong bear reversal bar at 3:00 due to profit taking from the bulls.
In this case too, I believe that trapped bears were largely being used to drive the market to new highs which may be why the profit taking was so aggressive when it got there. Furthermore there was probably relatively little sell side liquidity standing in the way until the market reached the measured move target which potentially explains the tightness of the bull channel up to the MM target. This series of events makes me believe that the rallies to new highs don’t have much underlying bullish strength.
I know you’re not a fan of Market Profile, but do you make any distinctions between “day time frame” and “other time frame” participants in your analysis? For example, the 4/15/21 open drive may be seen as a sign of strong other time frame buyers being present early in the day contributing to the directional conviction that was seen. They would’ve had the buying power to prevent the low probability short from having follow through. Seeing what didn’t happen that reasonably could’ve may have contributed to the higher degree of directional conviction to the upside once the market did break out.
Have a great weekend!
You are right about Market Profile. I spent several days with Peter Steidlmayer, I think in 1988, and concluded that I can see trading ranges very well on a bar chart and don’t need a Market Profile to see them.
Also, time is important, and it gets lost in a Market Profile. That is the same reason why I prefer price/time charts over price/volume or price/tick charts. I exist in time, as does the market, and it is just too big a part of life and of the market to ignore it.
As you know, traders from all time frames are constantly trading, and they trade for every conceivable reason. As you also, every strong move on the open is a test of support or resistance, and each has a 50% chance of reversing, no matter how strong the move is.
To simplify things, I classify market participants as strong or weak. The reality is that strength is distributed in a Bell curve. Also, sometimes a strong firm does something stupid and is weak, and sometimes a weak firm is strong.
I talk about climaxes this way to give readers an understanding of the forces at play. They then can anticipate what will unfold and have a better chance of trading profitably.
I think of the market as a stew. When I stir it, sometimes I see mostly potatoes and other times mostly carrots. I don’t give it any thought because I know there are lots of things in the pot, and for unknowable reasons, or at least reasons that do not interest me, one thing or another becomes more prominent.
The same is true with chart patterns. Sometimes the market forms a lot of wedges, and then a lot of double tops and bottoms. I don’t care. As long as I understand what is likely to follow, I can structure a profitable trade.
It is usually impossible to know which market participant is most active. During a huge rally, everyone is buying. In a bear trend, everyone sells. Sometime you can tell. For example, if the market is getting very close to a magnet, the high frequency traders become more active, confident the market will continue to go a few more ticks to the target.
Thank you for your time, Dr. Brooks!
I have moved away from using Market Profile and Order Flow over time. Having the background knowledge of auction market theory from the CBOT Market Profile manual, Jim Dalton, and Peter Steidlmayer and market microstructure from trading order flow has continued to be useful even though I don’t look at those things directly any more. You also did an excellent job teaching those ideas in your textbooks and course as viewed through the lens of price action. Like you, I’ve moved towards being a price action purist. Price action strikes the best balance between context and detail that I know of. It’s the same market anyway and I prefer using this lens to analyze it. Plus many Market Profile traders expand out the profile during the session so they’re essentially just looking at a 30 minute bar chart anyway.
For quite some time I used price/volume charts since I figured that it made sense to use equally weighted bars to read price action and since it is the buying and selling of contracts that moves markets. Price/tick charts can potentially be useful for people who use a volume subgraph and try to determine whether the average lot size increased or decreased to attempt to decipher who might be in the market, but I haven’t experimented with that much personally. The main time when I think that data-based charts can be potentially more useful than time-based charts is for traders who concentrate on trading breakouts. Bob Volman, a price action trader, wrote a lot about watching for build ups at the edge of a signal line in the direction of the dominant pressure to trade breakouts using a 70 tick chart for the EUR/USD pair.
That being said, I’ve gone back to a 5 minute chart because I find it easier to see climaxes, measured moves are more precise, relative quality of breakouts can still be assessed adequately, and because the dynamics at the highest and lowest close that you have elucidated tend to be more visible on a price/time chart. I’ve come to understand why you emphasize the importance of having consistent amounts of time to think as well. Furthermore, I appreciate your sentiment that “there is no noise” and prefer not having activity being compressed. I do also think that traders are impacted by the amount of time that they’re in a position waiting for certain activity to unfold, which relates to your idea of disappointing follow through and the importance of time in general.
I like the way that you classify market participants in relation to the price action, staying tuned into the activity itself rather than overthinking who might be responsible for it. To me it sounds like you’re reasoning from first principles and not getting too caught up in differentiating between many different types of participants (scalpers, intraday, swing, intermediate, long term) when it can’t be known for sure anyway. Plus those distinctions mainly just take outright traders into account, ignoring spread traders, market makers, etc.
I enjoy your stew metaphor, I’ve heard your fly fishing analogy but I haven’t heard this one before. Most of my market metaphors revolve around sports, often revolving around olympic weightlifting and surfing (for example, I recently heard a pro surfer saying, “I just do what the waves tell me to do” in an interview and thought that fit really well with trading). Many valuable trading lessons came from listening to military spec ops soldiers. Alex Honnold’s distinction between risk and consequence in free soloing is an interesting parallel as well. Come to think of it you may enjoy this video: https://www.youtube.com/watch?v=QHVSeqzI1vU It revolves around a professional mountain guide and although it’s not about trading at all it has many wonderful lessons that apply to trading. The “gap” that he talks about between perceptions and reality, reminded me of Kant’s distinction between phenomena and noumena and how that can apply to how we perceive market information. Anyway I’m going off on a wild tangent now and don’t want to take up any more of your time. Thank you again!
Al thanks for the detailed report.
All types of traders described in the last 2 paragraphs represent classical institutionals behave with the associated ~90% magnitude of volume weight?
Institutions probably create 95% of the volume. Any generalization is always about institutions because they are the market. There are a many strong ones, and many more weak ones.
Just because a hedge fund is on Wall St. does not mean that it is profitable or smart. Any convincing fool or thief can raise a lot of money, e.g., Madoff.