Market Overview: DAX 40 Futures
DAX futures was a big bull bar closing near its high. It is consecutive monthly bull bars, a DAX 40 bull flag breakout and a High 3 buy, but we are right in the middle of the trading range, forcing traders to make tough decisions. The bulls see the pullback and continuation of the longer bull trend. The bears see a 50% retracement and 2nd leg trap to sell again for a move down. Likely both bull and bear traders will be disappointed.
DAX 40 Futures
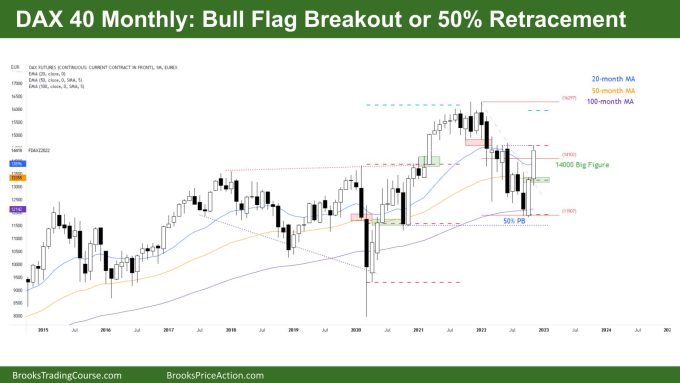
The Monthly DAX chart

- The DAX 40 futures last month was a big bull bar closing near its high.
- It is the second consecutive big bull bar closing on its high, so we are likely always in long.
- The bulls see a wedge bull flag breakout, a High 3 buy setup and a good entry bar for a test of the range highs. They want a breakout above the high for a measured move.
- The bears see a tight bear channel, a possible 2nd leg trap, and a 50% retracement for a reasonable sell. They see a failed breakout above a trading range and a return back into it.
- The bears want to create a lower high and might see the 2022 bear leg as leg 1 of a two-legged correction back down.
- But it is a buy signal, not a sell signal. Bulls will need to buy high in a possible trading range, and bears will need to sell a low-probability signal bar.
- The bears didn’t break a major swing low, so it is better to be long or flat. The stop is far away.
- Lots of sideways to down price action this year with fewer stop-entry setups, which was surprising last month as October was the best buy signal this year.
- Bulls needed to get up here where the first buy signal appeared in this bear leg – a moving average gap bar buy, which failed. Bulls who took it would have scaled in lower above July and October.
- Some bulls got out at 50% – a breakeven trade and others held and now avoided a loss and made a profit. So we can expect some profit taking here.
- Bears who sold too low will look to sell here and higher to do the same – which is why I think it is more likely we form a trading range here around 14000 Big Round Number.
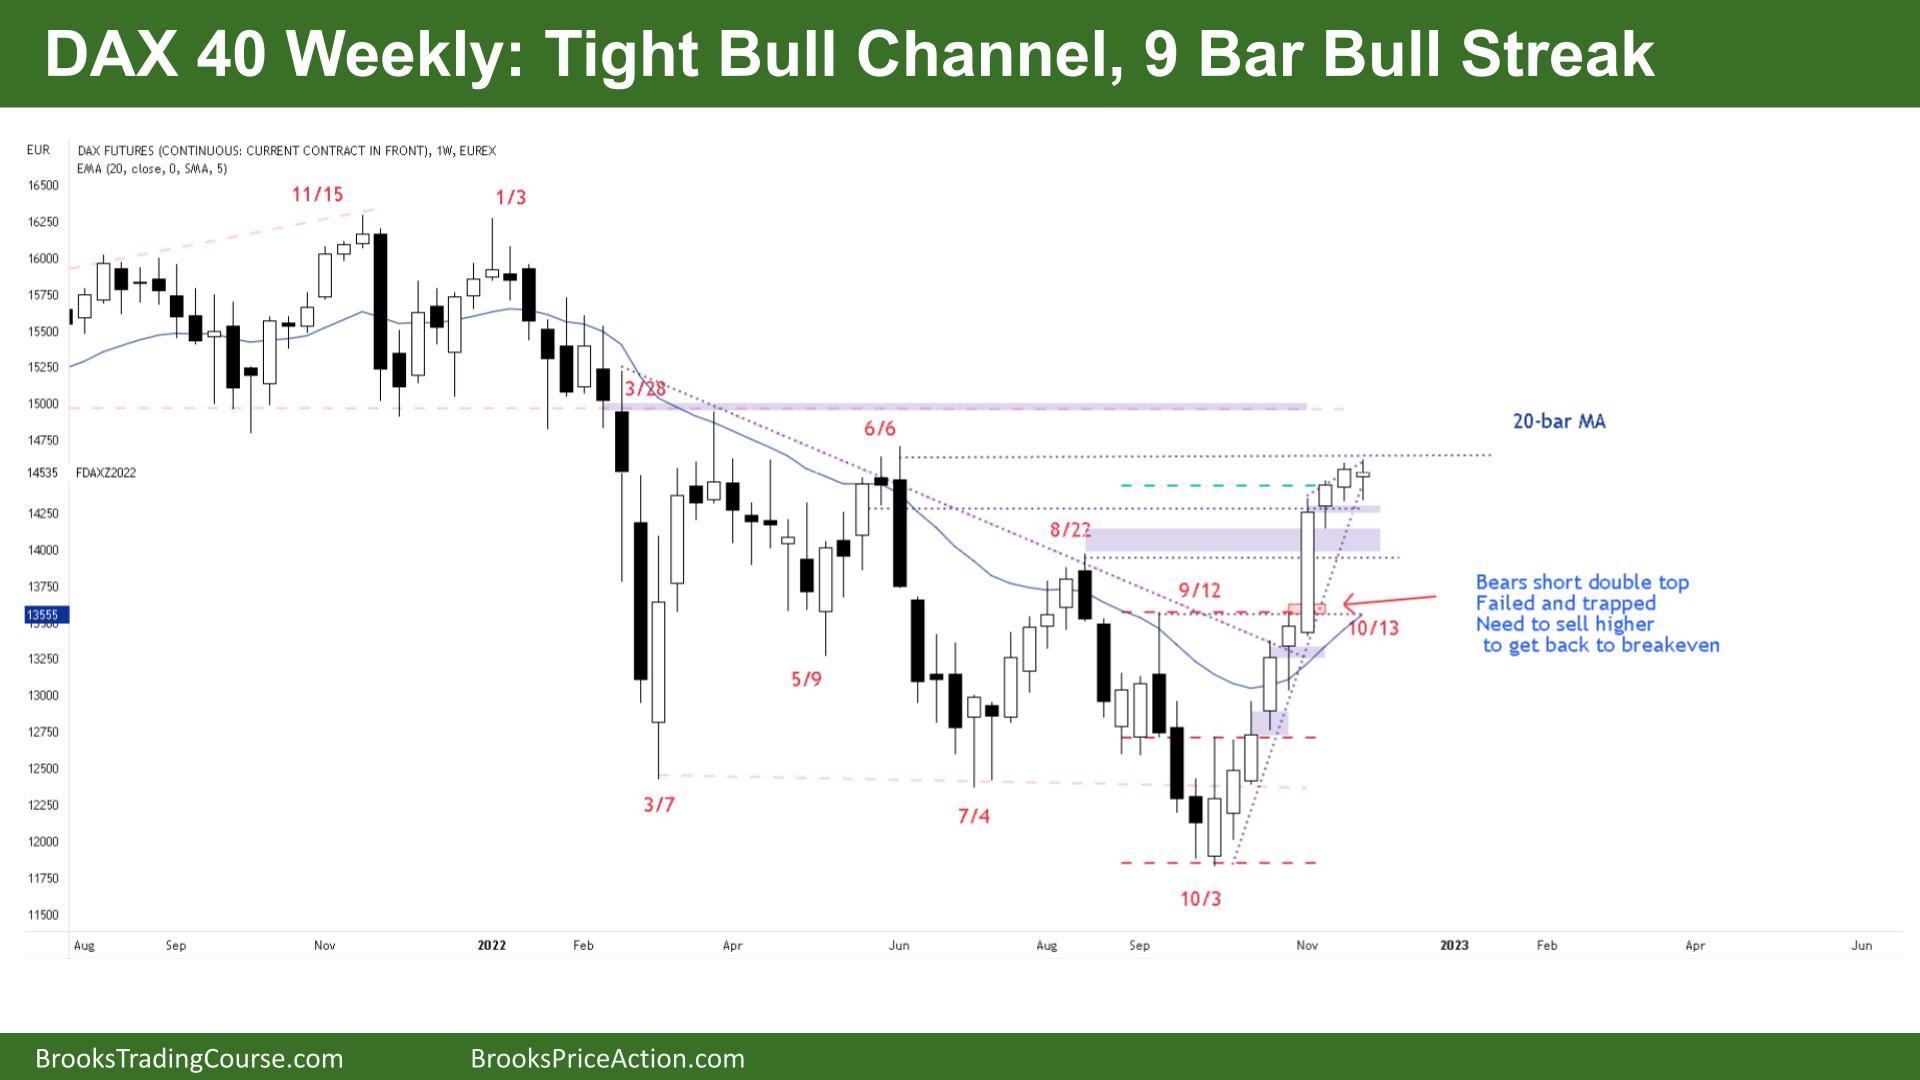
The Weekly DAX chart

- The DAX 40 futures last week was a bull doji high in a tight bull channel and 9-bar bull streak.
- It is climactic, but trends can often go much further than anyone expects.
- It is a wedge bull flag on the higher time frame.
- It’s a sideways bar pausing at a measured move target and swing target.
- For the bulls, it is a higher high and breakout above a broad bear channel, a wedge bull flag on a higher time frame.
- The bears it is a leg in a trading range and will look to sell reasonable bear bars high in what they perceive as the range.
- But where is the range?
- Bulls want to reach a measured move from the lowest high to the bottom of the trading range above.
- The bears know that would be a breakout test of the move down, so that could be the top of the range. Trading ranges go past swing points, so a breakout there is likely a reasonable sell signal.
- But it’s nine bull bars, so there is nothing for most bears to sell yet.
- Some bears are trapped at the double top below and will look to sell this double top on the 6th of June.
- But with a HTF buy signal, the risk might need to be much further than they expect. Most traders should be entering on stops.
- Better to be long or flat as we are always in long. Bulls to it below a reasonable sell signal, but might also be a pullback for a second leg higher.
- The channel is so tight that the first reversal is likely to be minor and close some gaps only before continuing higher. Most will form a bull flag and continuation.
Market analysis reports archive
You can access all weekend reports on the Market Analysis page.

