Market Overview: Crude Oil Futures
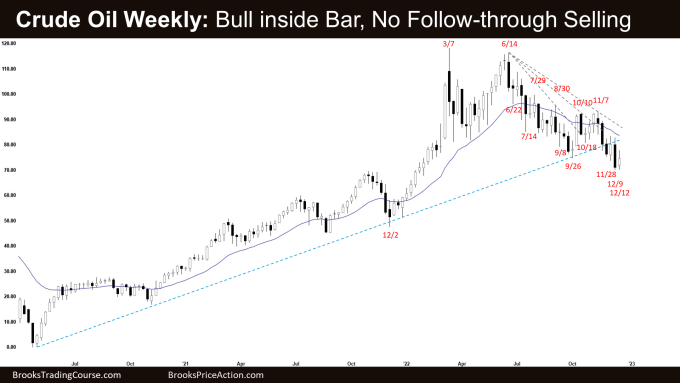
The Crude oil futures was a Crude Oil inside bull bar on the weekly chart. The bears did not get follow-through selling this week. They hope the inside bull doji is a pullback and want another leg lower. The bulls want a breakout above the inside bull doji. They want a failed breakout of the trading range and the bull trend line.
Crude oil futures
The Weekly crude oil chart

- This week’s candlestick on the weekly Crude Oil chart was an inside bull doji with a long tail above.
- Last week, we said that favors Crude Oil to trade at least a little lower. Traders will see if the bears get follow-through selling or not.
- This week did not trade below last week’s low, and the bears failed to get follow-through selling.
- The bears got a reversal lower from a double top bear flag (October 10 and November 7).
- They then got the second leg sideways to down retesting November 28 low and a breakout below the September low.
- Bears hope that this week was simply a pullback and wants another leg down breaking below December 9 low, completing the wedge pattern (first two legs being Nov 28 and Dec 9).
- They want a measured move down using the height of the September to November trading range which will take them to around $56.
- For that, the bears will need to create consecutive bear bars closing near their lows to convince traders of lower prices.
- The bulls want a failed breakout below the September low and the bull trend line.
- They want a reversal higher from a lower low major trend reversal and a micro double bottom (Dec 9 and Dec 12).
- The last 4 candlesticks had a lot of overlapping price action which indicates trading range behavior and that the bears are not yet as strong as they would like to be.
- Since this week’s candlestick was a bull doji with a long tail above, it is a weaker buy signal bar. It is not a good sell signal bar.
- Being an inside bar means Crude Oil is in breakout mode. Bulls want a breakout above this week’s high while bears want a breakout below this week’s low.
- The candlestick after an inside bar sometimes is another inside bar, forming an ii (inside-inside) pattern, or has a lot of overlapping price action.
- The first breakout from an inside bar can fail 50% of the time.
- For now, traders will see if the bulls can break above the inside bull doji.
- If they do, especially if it is a strong breakout closing near its high, the odds of a retest of the 20-week exponential moving average and the bear trend line increase.
- The US Government will start buying oil, and refilling the SPR (Strategic Petroleum Reserve). (Source: Reuters – U.S begins buying back oil…)
The Daily crude oil chart

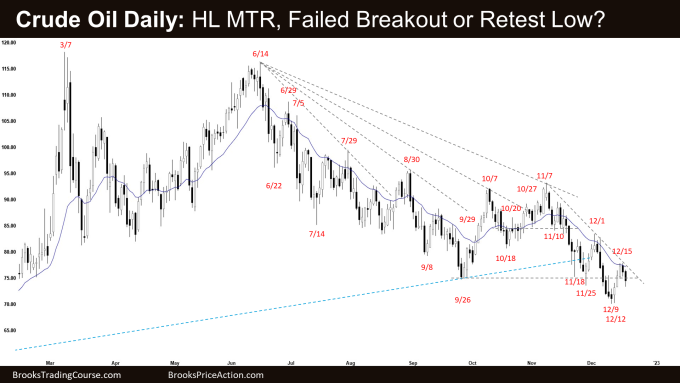
- Crude Oil traded higher from Monday to Wednesday retesting the September low breakout point and the 20-day exponential moving average.
- Thursday and Friday traded lower, forming the second leg sideways to down.
- Last week, we said that the odds slightly favor Crude Oil to trade at least a little lower. If there is a small pullback (bounce), odds favor at least a small second leg sideways to down after the pullback.
- The bears got a reversal lower from a double top bear flag with October 7 high.
- They then got a strong second leg sideways to down (6 consecutive bear bars) breaking far below the major bull trend line and September low.
- The bears want another strong leg down, forming the wedge pattern with the first two legs being November 25 and December 9.
- They want a measured move down based on the height of the September to November trading range which will take them to around $56.
- The bulls want a failed breakout below the trading range and the major bull trend line.
- They want a reversal higher from a lower low major trend reversal and a wedge bottom (Nov 18, Nov 25 and Dec 9). The bulls also have a micro double bottom (Dec 9 and Dec 12).
- They see Thursday and Friday as a small pullback and want a reversal higher from a higher low major trend reversal.
- The bulls will need to create consecutive bull bars closing near their highs, trading far above the bear trend line and the 20-day exponential moving average, to increase the odds of higher prices.
- Since Friday was a bear bar with a prominent tail below, it is a weaker sell signal bar for Monday.
- Traders will see if the bears can create a strong retest of the December 9 low followed by a breakout, or if next week surprises and trades higher breaking far above the bear trend line.
- The US Government will start buying oil, and refilling the SPR (Strategic Petroleum Reserve). (Source: Reuters – U.S begins buying back oil…)
Market analysis reports archive
You can access all weekend reports on the Market Analysis page.

