Market Overview: Bitcoin Futures
Bitcoin testing year lows. Because there is a heavy magnet around $30000, traders think that the price will get there at some point during the next quarters; However, before that happens, the price might suffer a 25% price decline from current prices, by testing the 2017 close. This would also mean about an 80% decline from the all-time highs.
Bitcoin futures
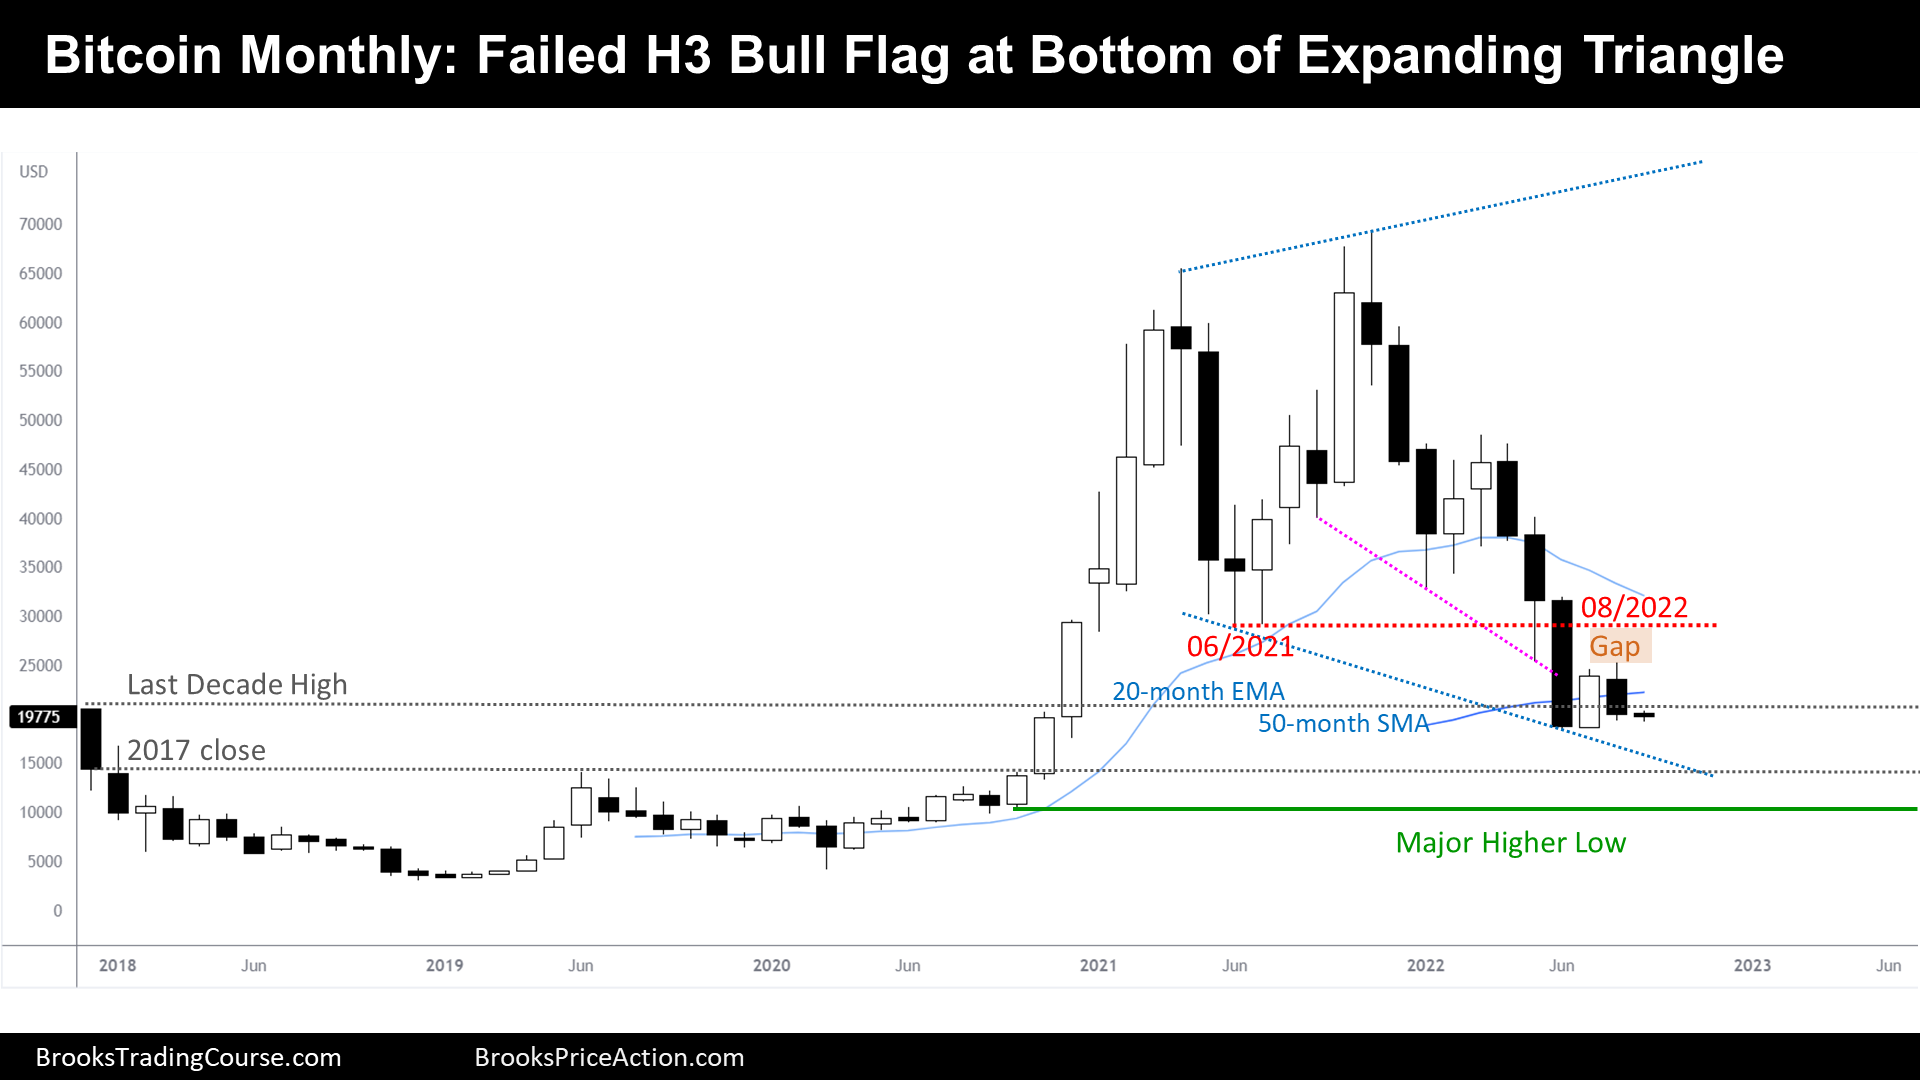
The Monthly chart of Bitcoin futures

- This month’s Bitcoin candlestick is a Low 1 sell signal bar. The monthly bar traded above July’s high, triggering the High 3 bull flag setup, but bulls failed as the price reversed down. Not only that, the bears closed below July’s midpoint, a sign of strength of the bears.
- After July’s bull momentum, traders thought that there will be a test of June 2021 low.
- So far, August failed to test the June 2021 low, and now it is headed to a new low of the bear leg, which will happen by trading below current year lows.
- If there is a new low of the year before first closing that gap between June 2021 low and August 2022 high, the bears will probably test the 2017 close, at $14470. This is a 25% decline from current prices.
- Bulls hope that this open gap, late in the wedge bull flag, it is just an exhaustion sign. They think that the worst-case scenario it is a trading range; therefore, they believe that anything happening on this chart it is a good excuse to buy. They might not be wrong, for now, while the price it is above the Major Higher Low which preceded the bull breakout late 2020.
- Bulls also want September to reverse up, closing above the 50-month simple moving average and form a micro double bottom.
- Bears see a good stop entry setup, Low 1 on a bear trend. But they know that we are late in a bear trend and the context is probably a broad bull channel or a trading range. Furthermore, this would be the 3rd leg and there are many immediate support levels right below; bears selling below the August low, are trading small, and might be willing to scale in higher in case they are proven wrong.
- June close was the Semester close, the most important price from this year so far. After the Semester close, the price reversed up. Traders won’t be surprised if this happens again. Traders, will be looking for reversals at that price on lower time frame charts.
- By context, the price is likely at a buy zone of a broad bull channel or a trading range; Traders should expect bullish pressure during the following months.
- The price might test 2017 close before higher prices. But both bulls and bears will buy any price decline.
- If the bulls, surprisingly, close the gap between current prices and the June 2021 low, before there is a new low this year, it will probably mean that a bull leg has begun.
- Good stop entry bear setups at a buy zone of a trading range are actually good bull setups. If we are in a trading range, we should expect buyers below August lows. But because the prior bear leg was strong, we should not expect strong bull bars. Therefore, more likely, the September candlestick will be a bear bar with a tail below, or a bull bar with a tail above. Or a doji.
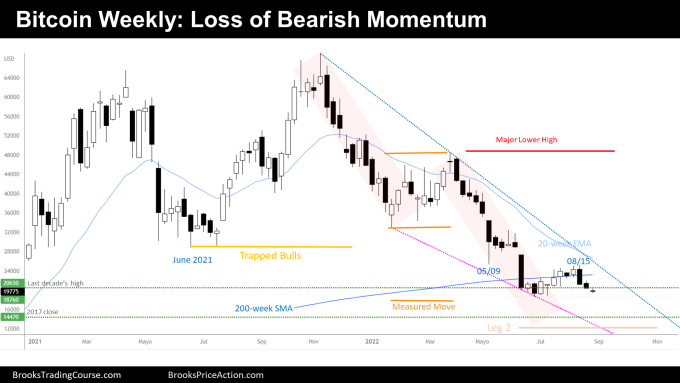
The Weekly chart of Bitcoin futures

- This week’s candlestick is a bear doji. It is the 3rd consecutive bear bar after a bear trend resumption.
- However, traders see a loss of momentum from the bears, as the bars are decreasing in size.
- Bears are near current year lows. They think that if they can trade below, some bulls who are trapped will exit their positions accepting a loss; hence, driving the price lower until their targets: Measured Move of a prior Bear Flag, 2017 close or even the Leg 1—Leg 2 projection.
- Because the bulls did not close the gap between the 05/09 low and the 08/15 high, they won’t buy below the lows of the year and will wait until a reversal pattern develops before buying again.
- As stated during the latest weekly report, it is hard for the bears to sell here because this is the 3rd leg in a bear channel, and they feel entering late. Thus, if they want to short, they will use a small position size.
- There are trapped bulls above, and this should be a concern for bears willing to sell. If they achieve a new low soon, the next reversal up will probably fail. But if they fail to make a new low and then the price closes the 05/09 gap, the 3rd bear leg and continuation of the bear channel will likely be over.
- Because there is a loss of momentum, we should expect a retracement happening within the following 1-3 weeks, testing prior week highs.
Market analysis reports archive
You can access all weekend reports on the Market Analysis page.


Thanks for the analysis. I look forward to reading them each time they’re published.
We are glad that you find the Reports valuable.
Wishing you a great weekend ahead, Haroun!
Josep.