Market Overview: Bitcoin Futures
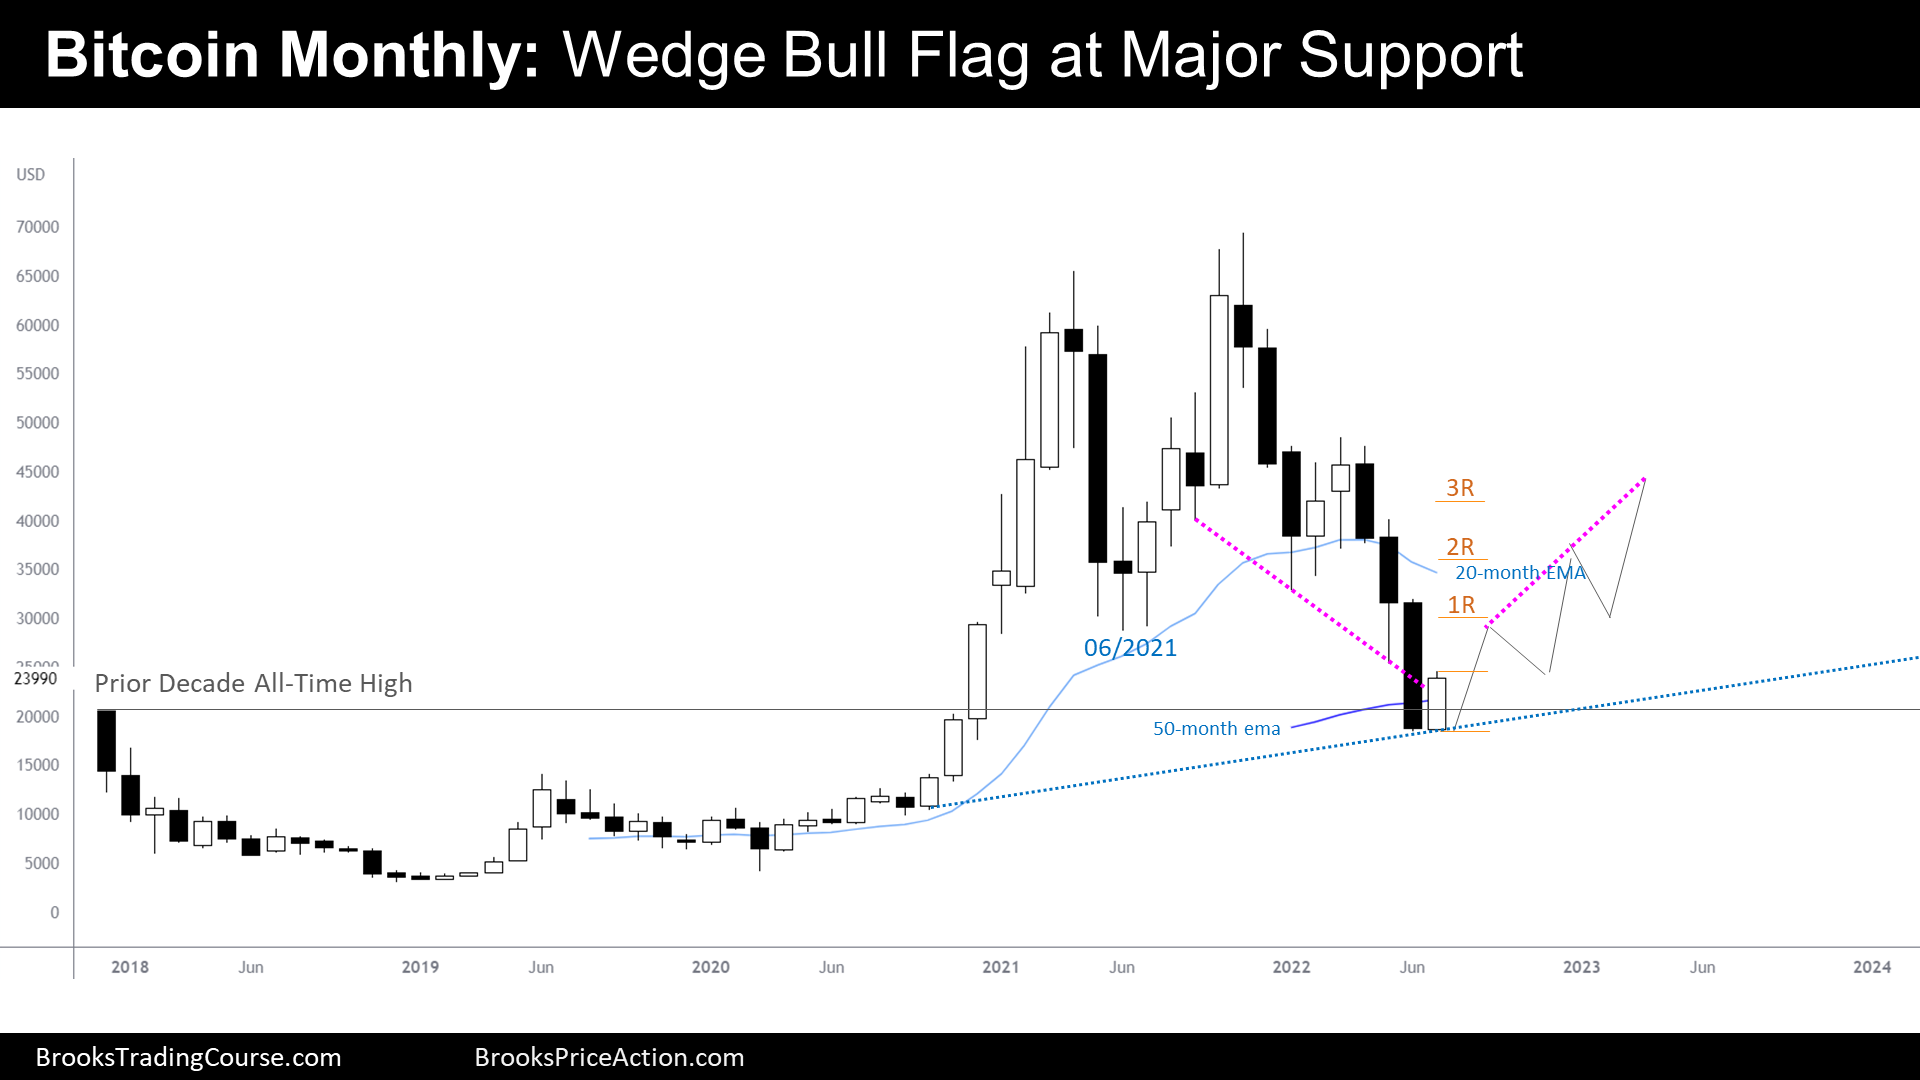
The Bitcoin futures gained 28% in July because Bears took some profits right at Major Support, the path of least resistance. During the prior Monthly Bitcoin Report, we mentioned that the most important level for the rest of the year would probably be June’s Close: After July’s follow-through month, Traders think that there will be buyers at that point if we test it back in the near future. Thus, the math works for long-term Bulls around current prices. August presents us with stimulating Price Action, as Traders expect to trade above July’s high, triggering the July’s Bull Signal Bar at a Wedge Bull Flag.
Bitcoin futures
The Monthly chart of Bitcoin futures

Context
- The Bitcoin price is still above the low of November 2020, where a Major Bull Breakout begun.
- That Breakout was very constructive for the Bulls, as ignited with three good bull bars increasing in size without overlapping between prior highs.
- When Breakouts or Channels are constructive during the early stages, Traders will find different ways to buy during a retracement.
- On June 2021, Traders bought a 50% retracement. Then, the Price reached an All-Time High. That signified a 100% gain for those traders, a gift to take profits: Bears got their excuse to fade a new high.
- Traders that fade new highs or lows, are Trading Range Traders.
- Trading Range Traders, Buy Low and Sell High. What will the Bears do who sold high when the price traded within a Buy Zone where there is a Major support? Buy back their shorts.
- Yet, last month we did not see any profit taking from the bears, but the information we had on the chart told us that there were enough incentives for traders to see bullish pressure around the June 2022 Low.
Math
- Traders do not place trades simply because they think that something is going to happen.
- Traders place trades when they think that the math is good to make money.
- It is reasonable to think that the price is at a Buy Zone area and that created a reasonable buy setup. The math is simple, there is a 60% chance that the price will trade upwards with an average size bar, before it goes the opposite way. Let’s say, an Average Size Bar on a Monthly Chart of the Bitcoin Futures is around $10000.
- 60% chance that Bitcoin will trade at $34000 before it’s trading at $14000. That’s what will normally happen with a situation like this.
- There is a 40% chance that the price will trade below $15000 during the next 10 months, 40% setups happen often.
The path of least resistance
- The following lines will be an exercise on how to anticipate a sound scenario.
- For that, first, I assume that the bulls are going to hold above June’s close: I imagine this the most likely scenario of current price structure.
- By doing that, I can establish resistances based upon profit taking from Traders that will buy above July’s Bar at 1:1, 2:1 and 3:1 Initial Risk Targets.
- Aside from that resistance, there are others: 06/2021 low. We know from prior reports that there are weekly-chart trapped traders at that price, that may add a fair amount of selling pressure.
- 06/2021 low and 1:1 Initial Risk Targets are around, so it is reasonable to expect at least a pushback or a couple of ones, as we know from the Daily Chart that the price might fail to trade about 3 months above around $30000.
- That will give an opportunity for bears who sold at the Buy Zone before the Reversal up, to get, from their trades, an action that might power the 2nd leg up.
- The 2nd Leg up drawn could soon face the 20-Month Exponential Moving Average, but it is not very relevant during Trading Range Price Action; However, around there will be the 06/2021 close, which is a Monthly Price Level, a significant resistance.
- More important, Bulls who bought above the July 2022 Bull Bar would take 2:1 profits. This means that only 1/3 of Bull power will remain in the market.
- Then, why have I drawn a 3rd Leg up?
- Because it will make sense to me that Bears will not be willing to sell until the math is better. Or maybe until there is some kind of Bull Trap: Breakout above Prior Lower High, or any Stop Order Setup at the Sell Zone. Stop Order Bull Setups, within a Sell Zone of a Trading Range, are good Limit Order Bear Setups. Bad math for the bulls.
- In Trading Ranges, we consider that a Sell Zone is anything high in the Upper Half of the Range. With the scenario proposed, that is above $44000. Coincidently, right above the 3:1 Price Target.
- Now, this is how an analyst can anticipate reasonably a 5-move scenario.
- There are other scenarios to be drawn, this is the one that makes more sense to me today, with current information.
- Even if this we draw the most likely scenario, the result is not what will normally follow. However, occasionally, it does.
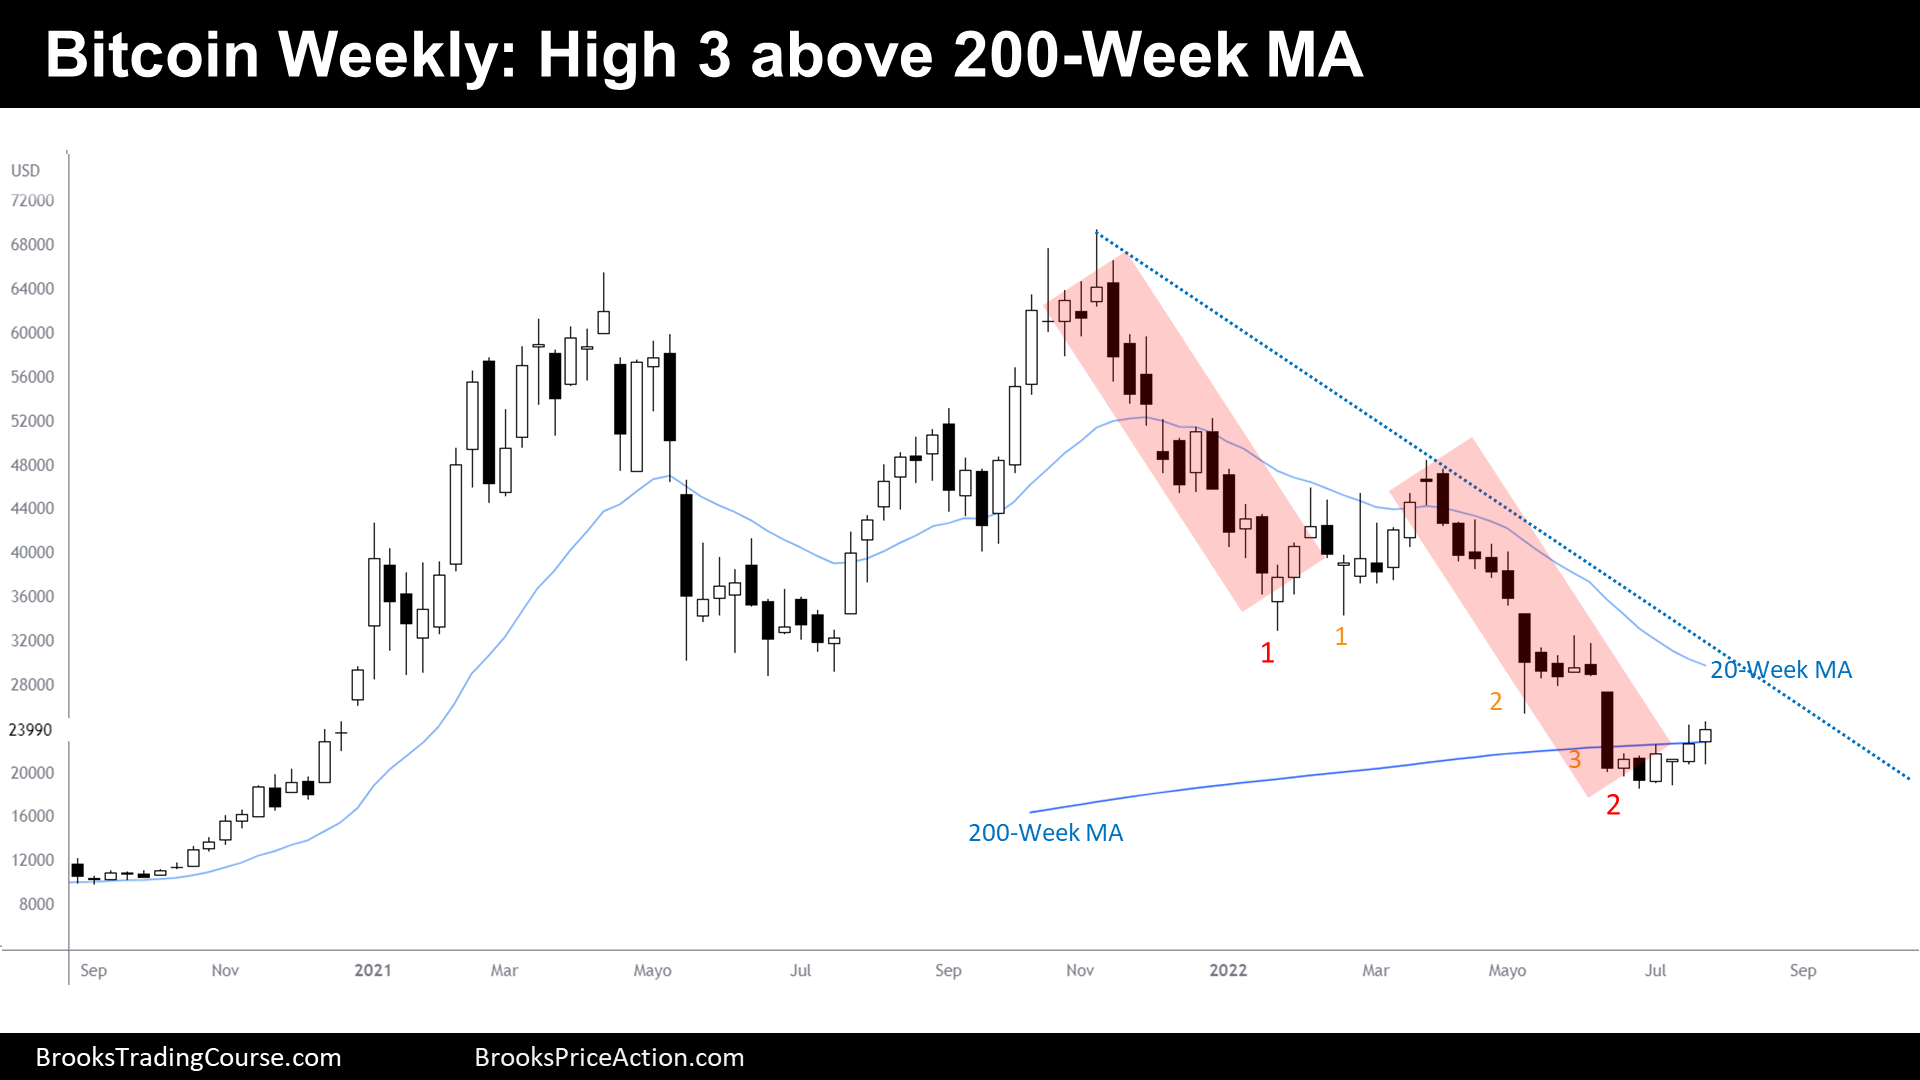
The Weekly chart of Bitcoin future

- This week is a High 3 Buy Signal Bar above the 200-Week Moving Average.
- This week we had an Outside Up Bull Reversal Bar with a prominent tail on top.
- Last week we said that there will probably be buyers below the low of the bar. We also said that one of the likely outcomes was a Trading Range bar, because there are sellers at 06/2021, and the upside potential is not very tentative. Meanwhile those Traders remain in the scene.
- We are seeing a very common Trading Range pattern unfolding on this chart, as we have said repeatedly during prior reports: 2 Legs in a Trading Range.
- Some Traders Buy the first reversal up of the 2nd Bear Leg. Others, prefer to wait a 2nd Entry.
- But we have also been saying that the 2 Legs were strong enough to create at least another Leg Sideways to Down.
- It would make sense that this leg down begins right where the Bull Trapped Traders Below 06/2021 will sell, because the Bear Participants would rather not sell at a probable Buy Zone, where current price sits.
- The odds favor a test of the 20-week moving average and 06/2021 low during the next months.
- Many Traders will be hesitant to buy, and they will rather wait to buy a hypothetical failed 3rd Leg down.
- Hesitance is a sign of Trading Range Price Action, therefore, we should expect Trading Range Behavior. This is, good Breakouts Bars, bad Follow Through. Trading Range bars followed by Breakout Bars.
- Last 3 Weeks were Trading Range Bars. We might see a Breakout Bar next week.
Market analysis reports archive
You can access all weekend reports on the Market Analysis page.


Thanks Josep, for this clear explanation and report of thought proces in mathematical approach of the path of least resistance, keep up the good work
Thank you very much for taking your time and writing this comment, John :D. It is important to know if this kind of information inspires other disciples.
Have a great week ahead!
Thanks Josep for fantastic report. Keep up with the great updates. Not clear to me why you consider this week as a H3 Buy signal bar? On the same subject re monthly chart, can we define July as a H2 buy signal bar while February was H1 buy signal bar?
Hi Eli, thank you for reading the Report!
Al is very flexible in regards of Bar Counting (and almost in everything).
I decided to name it H3 because “every wedge bull flag is a H3”. So it is more coherent to call this a H3 after selecting the monthly chart title I selected (Wedge Bull Flag at Major Support).
Indeed, we can also call this a H2. February was H1.
For those Traders like myself that consider that the Pullback started on Sep 2021, the H1 is Oct 2021, H2 feb, H3 is July (if triggers).
No fixed rules, it’s all concept.